The main purpose of this ongoing blog will be to track planetary extreme, or record temperatures related to climate change. Any reports I see of ETs will be listed below the main topic of the day. I’ll refer to extreme or record temperatures as ETs (not extraterrestrials).😉
Main Topic: A Much Hotter than Average Summer Outlook for Australia
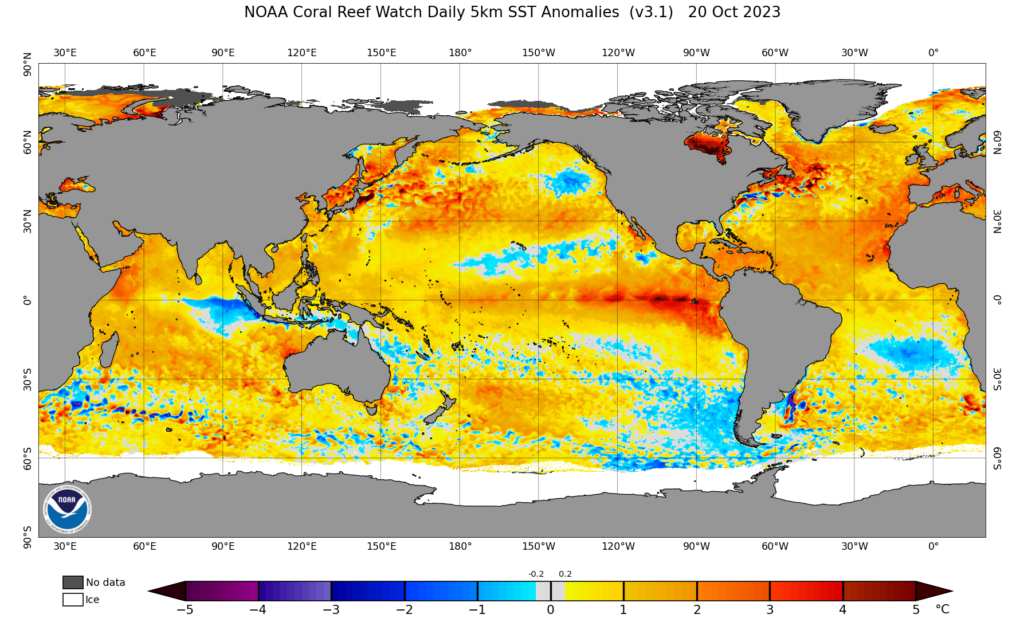
Dear Diary. I keep getting reports nearly every day of dangerous record spring heat from different locations across Australia. This is what we should expect because of climate change and especially because of a very strong El Niño. El Niño Pacific patterns tend to bring dry hot weather to Australia:
Here is a taste of record temperatures occurring across the island continent the last few days:
Australian Heat Wave Update:
— Extreme Temperatures Around The World (@extremetemps) October 21, 2023
44.6C today at Onslow and Mardie, 44.4C at Mandora
These temperatures were reached just before or just after midday before the breeze kicked in
It could have been worse
Records High Tmins for October today
26.8C Thevenard Island
26.2C Varanus Island https://t.co/bK7AjCjXng
More extreme heat in #Australia: Today the temperature reached 44.1C at Mardie, the first 44C of the season.
— Extreme Temperatures Around The World (@extremetemps) October 20, 2023
Monthly record broken at Meriddin with 39.5C.
Tomorrow even hotter with exceptional heat and widespread records and possible 45C. pic.twitter.com/dau40xmcgc
Australian Heat Wave Update:
— Extreme Temperatures Around The World (@extremetemps) October 21, 2023
44.6C today at Onslow and Mardie, 44.4C at Mandora
These temperatures were reached just before or just after midday before the breeze kicked in
It could have been worse
Records High Tmins for October today
26.8C Thevenard Island
26.2C Varanus Island https://t.co/bK7AjCjXng
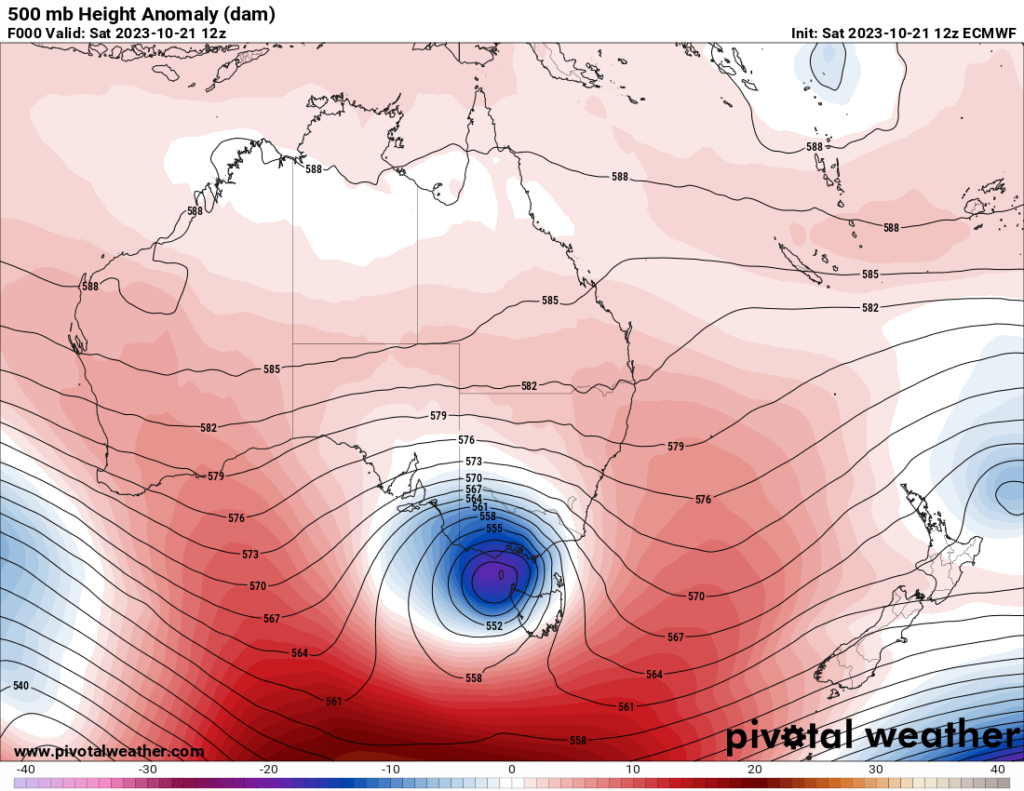
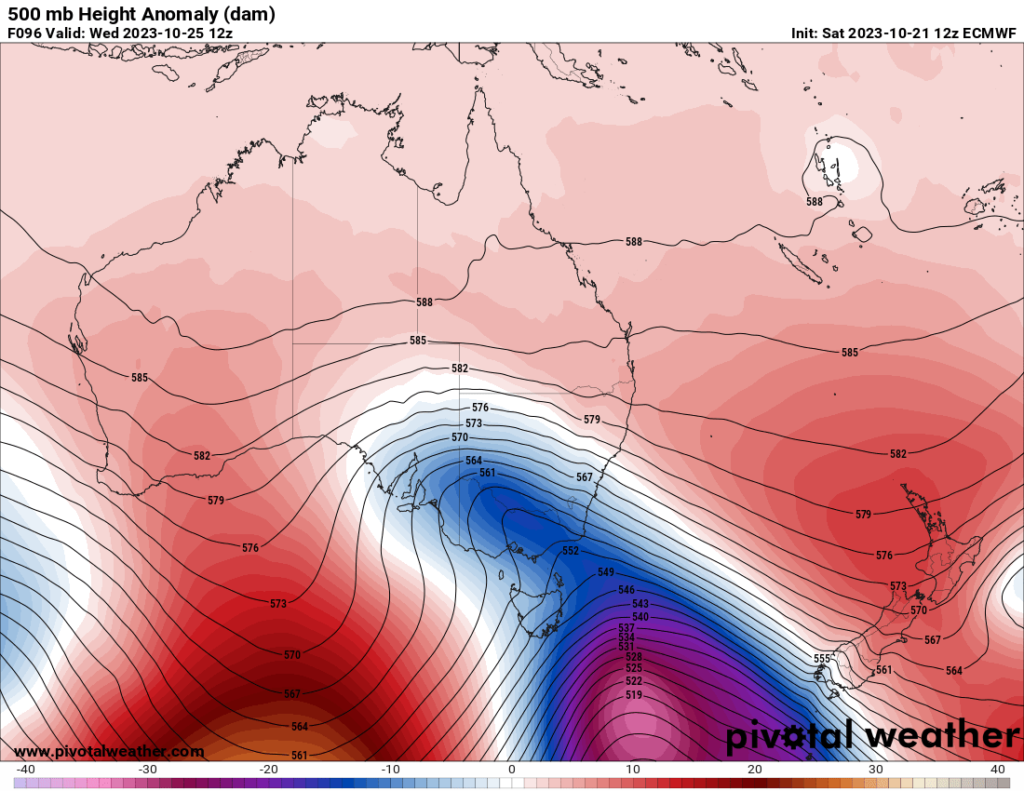
As far as a heat dome across Australia goes, we already see one stubborn anomalous ridge building across the continent this week, but at least there are some cold fronts still working their way northward:
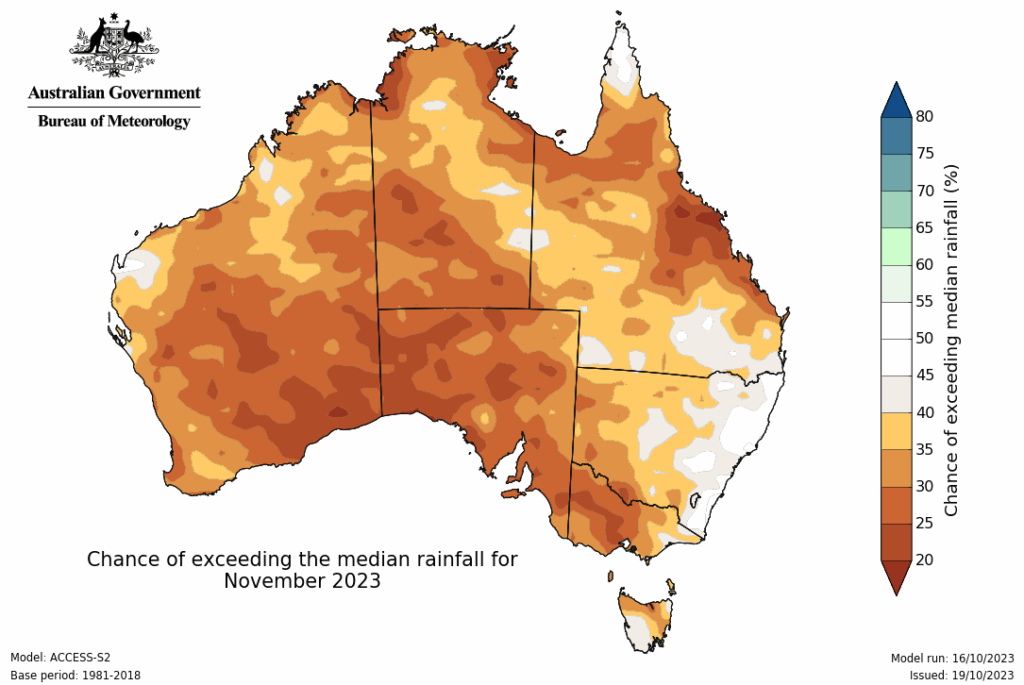
Here is a port from the Australian Meteorological Bureau indicating what to expect during the upcoming hot summer season from November through January:
Australian climate outlooks (bom.gov.au)
Climate outlook for November to February
Issued 19 October 2023
Long-range forecast overview
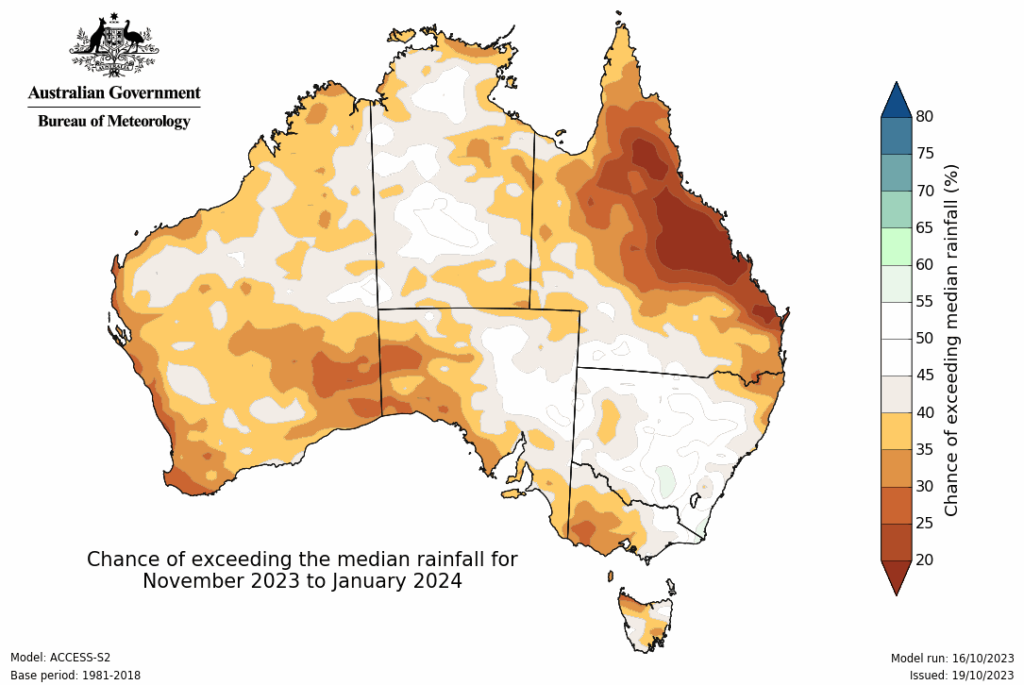
- November to January rainfall is likely to be below average across areas of southern, western and northern Australia, including most of Queensland.
- November to January maximum and minimum temperatures are very likely to be above average for most of Australia.
- November to January maximum and minimum temperatures are at least 2.5 times more likely than normal to be unusually high (in the top 20% of the climatological record) for most of Australia.
- The long-range forecast is influenced by several factors, including the El Niño and positive Indian Ocean Dipole events currently underway, and record warm oceans globally.
Drier than median November to January likely for western, northern and southern Australia.
- For November, below median rainfall is likely (60 to 80% chance) for most of Australia, except for the far north and south-east of Queensland, eastern regions of NSW, and south-west Tasmania.
- November to January rainfall is likely (60 to 80% chance) to be below median for most of Australia, except for central interior WA, interior NT, eastern SA, south-west Queensland, most of NSW, eastern Victoria, and south-west and north-east parts of Tasmania.
- Past accuracy of November to January long-range forecasts for the chance of above median rainfall is moderate to high for most of Australia, decreasing to low to very low for parts of central and areas to the north of the Great Australian Bight.
Rainfall maps (toggle-select to enlarge) MORE MAPS
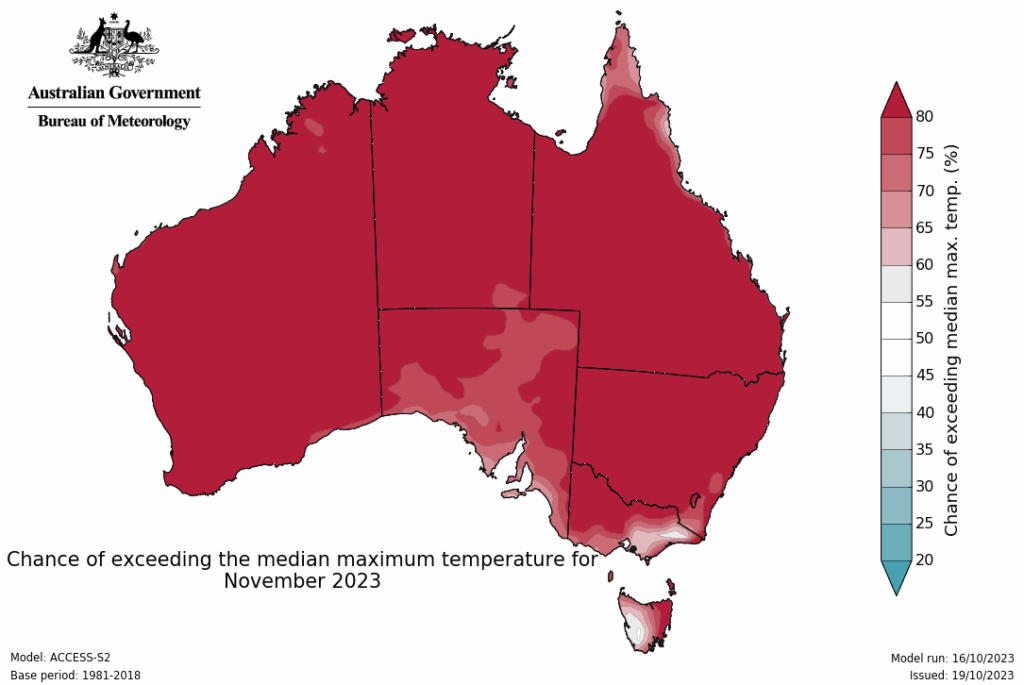
Warmer November to January days and nights for almost all of Australia
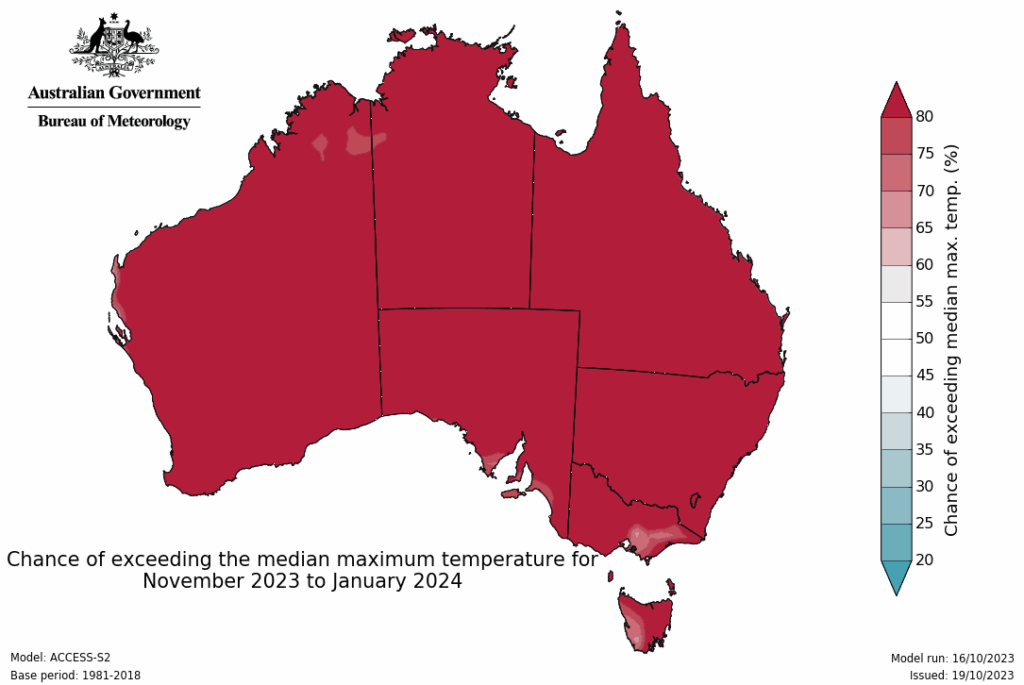
- For November, and November to January, above median maximum temperatures are very likely (greater than 80% chance) for almost all of Australia.
- For November to January, most of Australia is at least twice as likely as normal to experience unusually high maximum temperatures, with chances increasing to more than 4 times as likely for central and western WA, northern NT, and central Queensland. Unusually high maximum temperatures equate to the warmest 20% of November to January periods from 1981 to 2018.
- For November, above median minimum temperatures are likely to very likely (60 to 80% chance) for most of Australia, except for most of SA, western and central Victoria, south-west NSW, and northern and central coastal regions of Queensland.
- For November to January, above median minimum temperatures are very likely (greater than 80% chance) for almost all of Australia, excluding southern SA, western VIC and north- eastern Queensland where the chance of above or below median temperatures is roughly equal.
- For November to January, broad areas of Australia are at least 2 times more likely than normal to experience unusually high minimum temperatures, with chances increasing to more than 4 times as likely for much of eastern NSW; parts of central and northern WA; the Top End of the NT; and central Queensland away from coastal regions. Unusually high minimum temperatures equate to the warmest 20% of November to January periods from 1981 to 2018.
- Past accuracy of the November to January long-range forecast for chance of above median maximum temperatures has been high to very high across almost all of Australia, excluding the central NT, where it has been low. For minimum temperatures, accuracy is high to very high for most of Australia but decreases to low to very low for the northern Kimberley in WA, central NT, and a small area of central Queensland.
Maximum temperature maps (toggle-select to enlarge) MORE MAPS
Climate influences
The long-range forecast reflects known impacts from several significant climate drivers:
- El Niño is underway. Models indicate some further warming of the central to eastern Pacific is possible, with sea surface temperatures remaining above El Niño thresholds into the early southern hemisphere autumn 2024. El Niño typically leads to reduced spring rainfall for eastern Australia. As we head into summer, the below average rainfall signal contracts, with only parts of north-east and the far south-east of Australia typically seeing below average rainfall during this time. El Niño also typically results in warmer than usual spring days for the southern two-thirds of Australia, with summer also having a weak tendency towards warmer days across much of the eastern half of the country.
- A positive Indian Ocean Dipole (IOD) is underway. All models indicate that it will continue into at least the end of December. A positive IOD typically leads to reduced spring rainfall for central and south-east Australia.
- When a positive IOD and an El Niño occur concurrently, their drying effect is typically stronger and more widespread across Australia.
- The Southern Annular Mode (SAM) index is currently positive. Forecasts indicate it will move to neutral in the coming week.
- Australia’s climate has warmed by ~1.48 °C since 1910, leading to an increase in the frequency of extreme heat events.
The Bureau’s climate model simulates the physics of atmospheric, oceanic, ice, and land surface processes and uses millions of observations from satellites as well as in-situ instrumentation on land and at sea. These simulations enable the model to account for the influence of climate change and natural climate drivers like ENSO, IOD, the Madden–Julian Oscillation (MJO) and SAM in its long-range forecasts.
Of course, I’ll be posting more notes on Australian heat per Maximiliano Herrera such as the ones in our next daily section:
Here are some other “ET’s” recorded from around the planet the last couple of days, their consequences, and some extreme temperature outlooks, as well as any extreme precipitation reports:
HISTORIC
— Extreme Temperatures Around The World (@extremetemps) October 21, 2023
It's hard to describe the madness happening in Europe:Hundreds of records pulverized
>35C in Romania and Bulgaria,>33C Moldova and Albania
Few examples
ROMANIA
35.1 Magurele
..
32.9 Bacau
31.8 Constanta
BULGARIA 34.2 Varna
MOLDOVA 33.1 Tiraspol
UKRAINE 31.1 Odessa pic.twitter.com/rwx1AyI6FL
The magnitude of this European heat wave is hard to describe
— Extreme Temperatures Around The World (@extremetemps) October 21, 2023
20/21 Oct 2023 will be part of 3 centuries of European climatic history as one of the most extreme events on par with that of 2023 New Year
Some October records exceeded those of September and were close to summer's !
2
— Extreme Temperatures Around The World (@extremetemps) October 21, 2023
Incredible HOT NIGHTS in East Europe
TMINS up to 27C,some dropped during the day
18.9 POLAND,21.9 BOSNIA,25.0 MONTENEGRO
ROMANIA
23.7 Oravita NATIONAL RECORD
SERBIA
22.9 Vrsac,22.6 Belgrade NATIONAL AND BELGRADE RECORDS
ALBANIA 26.8 Vlore
25.5 Tirana,24.0 Kucova records https://t.co/C7nr8Xq3NL
Record heat in #Madagascar:
— Extreme Temperatures Around The World (@extremetemps) October 21, 2023
Yesterday the town of Maevatanana rose to 39.5C beating its record of 39.4C set in 1963.
The positive IOD suggests Madagascar will keep staying at record warm levels for weeks/months to come. pic.twitter.com/vEdikb1VST
One more record fell today in #Brazil:
— Extreme Temperatures Around The World (@extremetemps) October 21, 2023
42.6C at Diamantino (Mato Grosso State) hottest day in climatic history.
Watch the weekend will see another brutal heat wave with temperatures above 45C in Paraguay and adjacent areas of Argentina and Bolivia. https://t.co/cu0D0VVCTn
Fierce heat also in Mauritania.
— Extreme Temperatures Around The World (@extremetemps) October 20, 2023
Aioun al Atrouss with 44.2C broke its historic October record of 43.5C which was set in 1972 and 2003.
Around 130 countries/territories this October broke at least 1 monthly heat record so far.
This was unthinkable before June/July of this year. https://t.co/8vB366fcXD
🌡️108°F/42.2°C in Palm Springs and 6 miles SSW of Ogilby, CA are one of the highest temperatures ever recorded so late in the #USA.
— Thierry Goose (@ThierryGooseBC) October 21, 2023
According to @extremetemps, the latest 108°F ever recorded in the USA may be Indio, CA on Oct. 24, 1959. #CAwx pic.twitter.com/gg2nhwvPGK
October 20th ?
— Extreme Temperatures Around The World (@extremetemps) October 20, 2023
Most of the USA is with abnormal warmth for this time of the year, temperatures still reaching 105F in the SW, and 90F in Colorado.
This exceptional warm spell is close to end with the last couple of warm days in this weekend. https://t.co/QweBoG1Hgr
#Phoenix recorded its 7th consecutive 100F day, tying the record for longest #heatwave after the first week of October. The current heatwave was unprecedented, as it included two 104F highs and one 105F high, none of which had previously occurred after October 10th. #azwx pic.twitter.com/VYpGfrMcZo
— Don Sutherland (@DonSuth89069583) October 22, 2023
Here is some more brand-new September 2023 climatology:
Comparing #Arctic sea ice extent in 2023 to a reconstruction from over the last 150 years – it's pretty clear what has happened 📉
— Zack Labe (@ZLabe) October 21, 2023
You can read more about this data set at https://t.co/7q9EnNfS0C. pic.twitter.com/udYoJqy3bF
Here is More Climate and Weather News from Saturday:
(As usual, this will be a fluid post in which more information gets added during the day as it crosses my radar, crediting all who have put it on-line. Items will be archived on this site for posterity. In most instances click on the pictures of each tweet to see each article. The most noteworthy items will be listed first.)
For 10,000 years, climate & access to water have been fundamental drivers of human societal dynamics and conflict in the middle east. My op-Ed in @TheHill: https://t.co/C8fyuYwyl6
— Prof Michael E. Mann (@MichaelEMann) October 21, 2023
It becomes more and more grotesque how people pretend, they do not hear the approaching of apocalyptic riders. https://t.co/Wvr7JT5IaZ pic.twitter.com/Ope0aZkx74
— Thomas Reis (@peakaustria) October 21, 2023
An unbelievable warming-supercharged 2023 wildfire season in Canada coming to an end. Huge unprecedented greenhouse gas emissions, worst-ever toxic smoke pollution as far south as Florida. https://t.co/3sx2cyR8Ho pic.twitter.com/ZR2DXzLAc7
— Jonathan Overpeck (@GreatLakesPeck) October 21, 2023
Climate scientists predicted Canada would burn big & release lots of stored CO2: “It is no surprise that the boreal forest of Canada is starting to show a substantial increase in wildfire and a related net increase in carbon emissions to the atmosphere” https://t.co/qLhhc4zqK2
— Jonathan Overpeck (@GreatLakesPeck) October 21, 2023
Climate change is altering the water cycle — changing the timing, distribution, amount, and intensity of precipitation across the U.S. and around the world. https://t.co/fkgCgVRNVr #ClimateMatters pic.twitter.com/zBGpdshWra
— Climate Central (@ClimateCentral) October 21, 2023
“Dramatic decline”: Calgary researcher says sea ice in Antarctica lowest since 1986 – The Canadian Press https://t.co/4fFIJZtmP1
— Paul Beckwith (@PaulHBeckwith) October 22, 2023
Your 'moment of doom' for Oct. 21, 2023 ~ All of us are waking up.
— Prof. Eliot Jacobson (@EliotJacobson) October 21, 2023
"It has been very painful…to wake up with the city covered in smoke, experience extreme temperatures exceeding 40°C, and follow the news that the river waters are disappearing"https://t.co/9S69rZ0OQD
#SaturdayAfternoon Reading: #ExtremeWeather: “That does have a benefit, that does help lower the speed of the water running into rivers” Farmers could be paid for use of land to ‘slow down’ flood water in a changed #climate. From Irish Times: https://t.co/dqczu8BaSv
— Silicon Valley North (@CCLSVN) October 21, 2023
Life on Earth is dying
— GO GREEN (@ECOWARRIORSS) October 21, 2023
This is just one example
A hot House is death for life
Humans will not be immune
Billions of Alaska snow crabs likely vanished due to warm ocean, study says https://t.co/CJWT2Rm5RP
"..we don't understand the surprise upward leap that is happening now, and that worries me."@rahmstorf
— Sophie Gabrielle (@CodeRedEarth) October 21, 2023
STEFAN RAHMSTORY #ClimateEmergency pic.twitter.com/YprORZDEyu
How humans derailed Earth's #climate in just 160 years
— GO GREEN (@ECOWARRIORSS) October 21, 2023
For 11,500 years, atmospheric CO2 concentrations hovered around 280 ppm (preindustrial “normal”) with an average surface temperature around 15°C
Now co2 levels highest in 5 million years and risinghttps://t.co/6vunIpDv5Z
Today’s News on Sustainable, Traditional Polluting Energy from Fossil Fuel, and the Green Revolution:
Good morning with good news: 107 countries are 5 years or more past peak fossil fuel use to generate electricity reports Ember. https://t.co/Ama2YgjOgw
— John Raymond Hanger (@johnrhanger) October 21, 2023
And peak fossil fuel use for all purposes is close! Why? EV, solar, wind, nuclear, EE & electrification!https://t.co/0UNutk5TWA pic.twitter.com/LUgKe3qbXQ
Construction approaches for Ohio’s first floating solar project https://t.co/uvKxPpOyF1 @SolarPowerWorld #WWS #WindWaterSolar
— Mark Z. Jacobson (@mzjacobson) October 20, 2023
1. UK watchdog comes to conclusion that hydrogen heating is inefficient, explosive and expensive compared to heatpumps.
— Just Stop Oil (@JustStop_Oil) October 21, 2023
2. Government ignores warning and pushes on in support of hydrogen lobbyists.
IT COULD NOT BE CLEARER — our government is completely paralysed by corruption. pic.twitter.com/vZE5cq5VOf
98% of Costa Rica's power already comes from #renewables. Half of the land is covered by forest. They're aiming to transform their entire economy to have a zero carbon footprint.
— Mike Hudema (@MikeHudema) October 21, 2023
It can be done, let's get moving. #ActOnClimate#ClimateEmergency #climate #energy #GreenNewDeal pic.twitter.com/pOkYNRWmJq
"Taken together, the United States got nearly 17% of its electricity from solar, wind and geothermal power in 2022. That’s up from just over 5% in 2013."
— Mark Z. Jacobson (@mzjacobson) October 21, 2023
Renewables are on the rise in the United States https://t.co/OS78jEtxsb @EnvAm @EnvCalifornia #WWS #WindWaterSolar
This unused fossil gas fracking well was re-purposed to extract geothermal heat for the community.
— Mark Z. Jacobson (@mzjacobson) October 21, 2023
Proposed North Yorkshire fracking site becomes source of clean, geothermal energy https://t.co/mFflNTwG7O
More from the Weather Department:
Massive floods after heavy rains in the Catcliffe of South Yorkshire, England 🇬🇧 (21.10.2023)
— Disaster News (@Top_Disaster) October 21, 2023
BY- Sheffield Online
TELEGRAM JOIN 👉 https://t.co/9cTkji5aZq pic.twitter.com/9rx1bk9sp5
As the UK suffers from #StormBabet, a reminder that the wettest month ever in the UK is 120 years ago in October 1903.
— Ed Hawkins (@ed_hawkins) October 21, 2023
But, we now live in a warmer world so if the weather patterns of October 1903 occurred again today then more rain would fall.
When it rains, it rains more. pic.twitter.com/Pt2X5cL9aV
Rapidly strengthening tropical cyclone Tej in the Arabian Sea is expected to make landfall near the Yemen-Oman border area early next week bringing a risk of major flooding. JTWC now calls for a 115 kts Cat 4 equivalent peak before gradual weakening prior to landfall. pic.twitter.com/53kJE5cMSa
— Nahel Belgherze (@WxNB_) October 21, 2023
A juxtaposition you don’t see often: in the Atlantic, Hurricane Tammy is moving through the Northern Leeward Islands, while in the eastern Pacific, Hurricane Norma is making landfall over southernmost Baja California, Mexico. Details here:https://t.co/f69qVtFC4T
— Jeff Masters (@DrJeffMasters) October 21, 2023
Someone needs to set the 12Z GFS forecast for #Tammy to yakety-sax…what in the world…a loop around Bermuda, missed recurve, and just chilling til it fizzles out in the SW Atlantic in 2+ weeks? 😆 pic.twitter.com/gNI34YVCGh
— Andy Hazelton (@AndyHazelton) October 21, 2023
Tropical Cyclone Lola has been named b the Fijian Meteorological Service and is currently about 2000 km away from the Qld coast (near Vanuatu). It currently looks highly unlikely that the Cyclone will directly impact Australian weather. pic.twitter.com/9KJ0rGDzU8
— Bureau of Meteorology, Australia (@BOM_au) October 22, 2023
Love this technology! https://t.co/IojFWQdtwr
— Jeff Masters (@DrJeffMasters) October 21, 2023
After several days of record warmth across much of CA, a weak system will bring scattered mainly light showers to NorCal on Sun. Then, a stronger but mainly dry "inside slider" low pressure system will move across Great Basin, bringing much colder/windier conditions in CA. #CAwx pic.twitter.com/83qALgb9xP
— Dr. Daniel Swain (@Weather_West) October 21, 2023
The first real Arctic blast of the season, coming just in time for Halloween! 🎃 🥶
— Ben Noll (@BenNollWeather) October 21, 2023
👻 As temperatures plummet and a frosty chill grips the air, it's as if Mother Nature herself is joining in the eerie festivities… pic.twitter.com/kamuVEWBsz
More on the Environment:
If your bath was overflowing, you wouldn’t just reach for a mop, you’d turn off the tap. This is what we need to do with plastic. To stay below 1.5°C for our climate, an ambitious #PlasticsTreaty is essential to cut plastic production by at least 75%! https://t.co/WBkidEilAt
— Greenpeace International (@Greenpeace) October 21, 2023
From our archives: “Humanity is running an ecological Ponzi scheme in which society robs nature and future generations to pay for boosting incomes in the short term,” a group of ecologists writes.https://t.co/rrG16oybQm
— Yale Environment 360 (@YaleE360) October 22, 2023
A new study reveals billions of people still lack access to safe water and sanitation.
— Greenpeace International (@Greenpeace) October 21, 2023
Growing populations, economies and urbanisation are putting strain on water supplies – with the #ClimateCrisis “drastically disrupting the world’s hydrological system”. https://t.co/EprJpBpKfz
Vasts swaths of abandoned farmland are ripe for rewilding, experts say, with huge potential to boost wildlife and draw down carbon.https://t.co/dg7NFpP6Y1
— Yale Environment 360 (@YaleE360) October 21, 2023
Hey, want to learn a mind-blowing fact? Over 40% of the United States is used for only one thing — growing meat, eggs, and dairy.https://t.co/iWHzJeEFqu
— Dr. Jonathan Foley (@GlobalEcoGuy) October 21, 2023
Water is sacred & essential for life. Everyone should be able to access it equitably & readily – not just the wealthy, not just corporations, not just colonial entities.
— Earthjustice (@Earthjustice) October 21, 2023
That's why communities in Hawai‘i are coming together to protect their public water.https://t.co/rA0VRLDwd5
Zoos are the opposite of educational: they construct fictions about their captives | Martha Gill https://t.co/rA62VxzEnC
— Guardian Environment (@guardianeco) October 22, 2023
More on Other Science and the Beauty of Earth and this Universe:
Night thoughts
— Green is a mission (@Greenisamissio1) October 21, 2023
Kindness and respect are at the top of my life's journey, but here it is very difficult for me to hold back. Only people can be so ruthless. pic.twitter.com/leEK0GnUgc
I wish my beloved and much appreciated fellow inhabitants of planet Earth on the journey of life a glorious good morning and a blessed day of wonderful encounters and experiences. Stay kind and healthy. May God bless you and all your wishes come true.❤️💙💚☘️🌿🌱🌲🌳🍀💚 pic.twitter.com/pQrIim8BSO
— Green is a mission (@Greenisamissio1) October 21, 2023