The main purpose of this ongoing blog will be to track planetary extreme, or record temperatures related to climate change. Any reports I see of ETs will be listed below the main topic of the day. I’ll refer to extreme or record temperatures as ETs (not extraterrestrials).😜
Main Topic: U.S. July 2025 Record Scoreboard and Climatological Review
Dear Diary. It’s time for our monthly climatological review. Here on this site, we usually present monthly summaries near the 10th of each month, and each is available by clicking the link below:
https://guyonclimate.com/category/record-scoreboard-climatological-reviews
I’m repeating this mantra every month:
July 2025 got ranked by the National Center for Environmental Information for the lower 48 states as 19th warmest or 113th coolest since records began being kept in 1895 at +1.81°F above the 1901-2000 average.
The above data was from:
https://www.ncdc.noaa.gov/cag/national/rankings
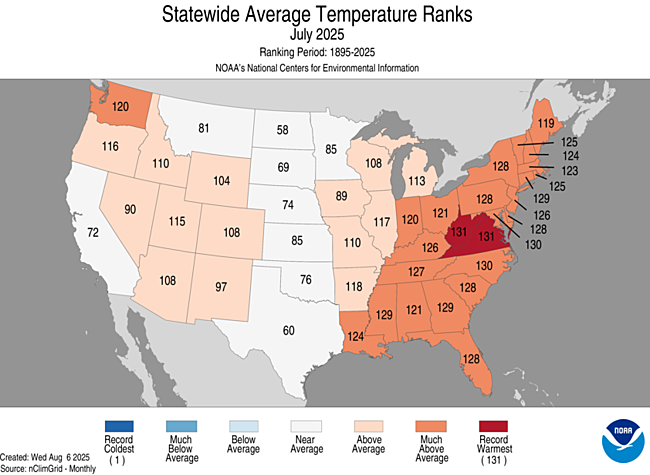
During July the warmest conditions were in the western and eastern portions of the nation. Many central states plus California had near average temperatures. Most reports of record chill came from the Southwest during the end of the month. Most reports of record heat occurred in the Northwest throughout the month with the bulk coming from the East due to another heatwave. Virginia and West Virginia had their warmest Julys on record. Interestingly July 2025 had far more record high min than low max reports.
You can check out record totals for yourself on my NCEI record archives:
NCEI Record Count Archive – Guy On Climate
Here are my two U.S. Daily Record Scoreboards updated through 7/09/2025 (data compiled from the following NCEI site):
https://www.ncdc.noaa.gov/cdo-web/datatools/records
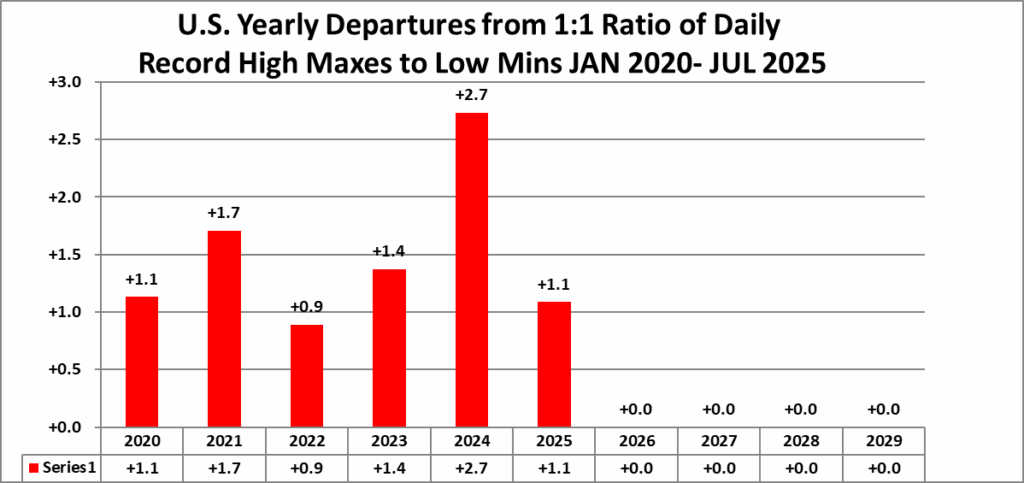
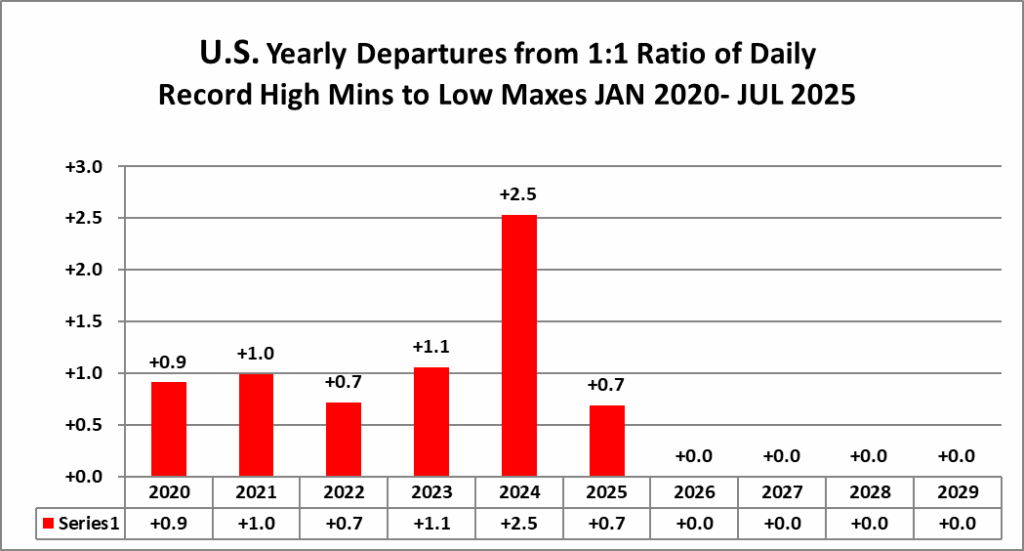
I’m also keeping tabs on record report totals to verify a scientific study I helped to complete in the decade of the 2000s. We’ll eventually see how skewed ratios of record warm to cold reports get by the year 2100, which the study mentions as 50-1 for DHMX vs. DLMN:
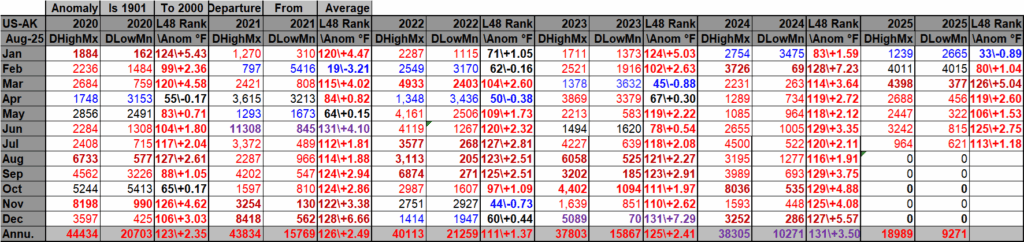
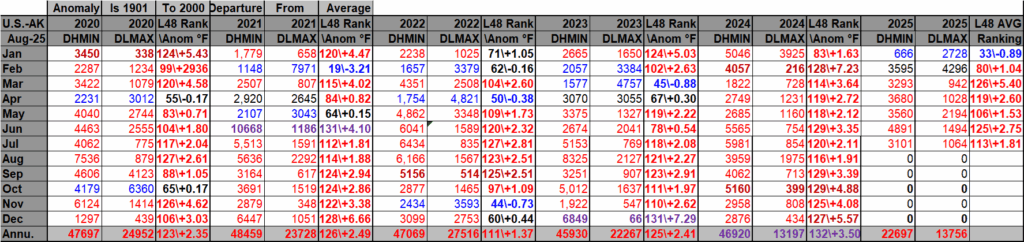
DHMX= Daily High Max Reports. DLMN= Daily Low Min Reports. DHMN= Daily High Min Reports. DLMX=Daily Low Max Reports.
Boldly highlighted red, blue, or purple colored months, such as December 2023 and June 2021, that have ratios of >10 to 1 daily or <1 to 10 of daily warm to low records are either historically hot or cold, most of which have made news. NCEI rankings are for the lower 48 states with the warmest ranking since 1895 of average temperatures being 131 and 1 being the coldest as of 2025. Blue colors represent cold months and red warm. Those months and years with counts close to a 1 to 1 ratio of highs to lows are colored black. All-time record hottest or coldest months and years are boldly colored in purple. NCDC rankings have been color coded (under tabs in each file) such that values of 55 to 75 are black representing neutral months or years (+ or – 10 from the average ranking of 64).
Totals are record reports for the entire United States including all territories minus those from Alaska. I’ve subtracted those from Alaska to get a better representation of what has occurred across the lower 48 states in association with lower 48 state rankings.
July 2025 had approximately a 19 to 12 ratio of record DHMX to DLMN individual record counts, so the color I used for that month was red on the top chart.
July 2025 had approximately a 3 to 1 ratio of record DHMN to DLMX individual record counts, so the color I used for that month was red on the bottom chart.
Due to climate change, we are seeing fewer blue colors on these Record Scoreboards with time.
The average temperature lower 48 state ranking for July 2025 was 113, which was colored red since it was warmer than average. We are seeing fewer blue colors on my charts, and July 2025 was yet another red or warm month.
I color rankings of +10 to -10 from the average ranking for the lower 48 states of 65 black, indicating that these are near average temperature wise. The top warmest ranking for 2025 would be 131 since rankings began in 1895.
Looking at the type and number of record reports, August 2025 has gotten off to a hot start, and meteorological models are consistently forecasting an above average August for temperatures. We did see a top 20 warmest July. Will we see a historic top 20 warmest August? Stay tuned.
Interestingly, here is what we see as far as overall yearly ratios go for the 2020s so far. Warmth is key here:
Here is much more detailed climatology for July 2025 as complied by NOAA:
https://www.ncei.noaa.gov/news/national-climate-202507
Assessing the U.S. Temperature and Precipitation Analysis in July 2025
Record overnight warmth dominated the eastern U.S. in July and multiple regions across the country were impacted by flash flooding

Published
August 8, 2025
Related Links
July 2025 U.S.Climate Report (Available August 13, 2025)
National Temperature and Precipitation Maps
Climatological Rankings Explained
State of the Climate Summaries
Key Point:
Most notably, catastrophic flooding in the Texas Hill Country in early July resulted in at least 135 fatalities, following extreme rainfall of up to 20 inches over just a few days.
Warm overnight minimum temperatures set July records, impacting more than 55 million people across the eastern states.
In July, 1,434 flash flood warnings—the second-highest July total in 40 years—and 17 flash flood emergencies were issued nationwide, along with over 2,000 preliminary flood-related storm reports.
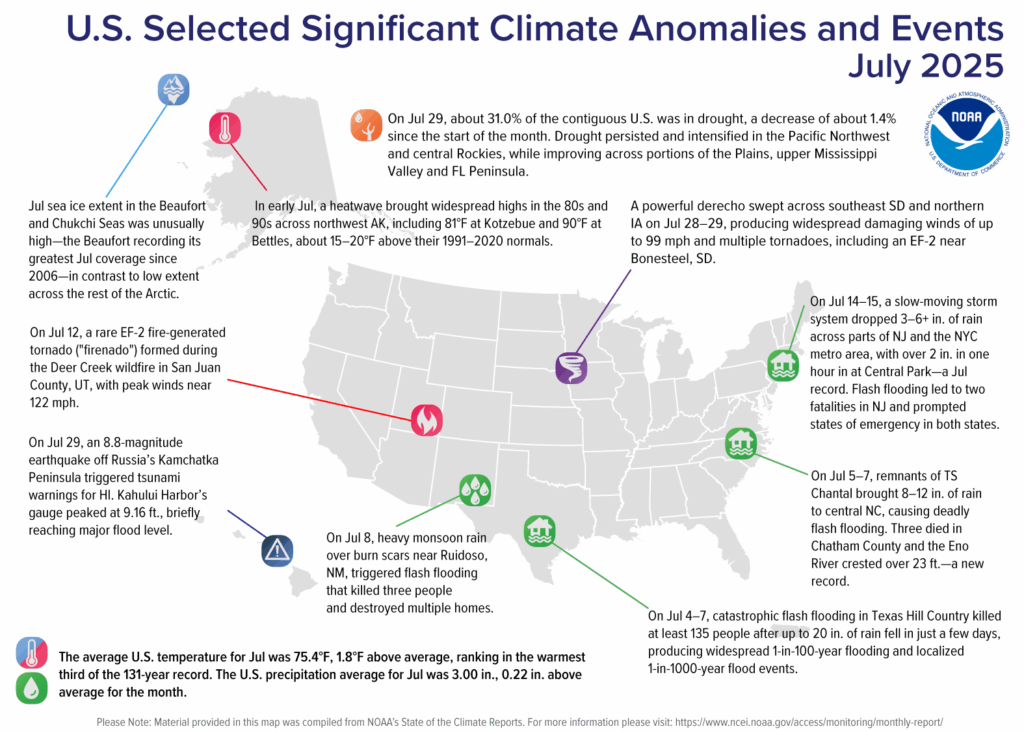
Map of the U.S. selected significant climate anomalies and events in July 2025.
Temperature
The average temperature for the contiguous U.S. (CONUS) in July 2025 was 75.4°F, 1.8°F above the 20th-century average, ranking in the warmest third of the 131-year record. Temperatures were above average across much of the Mountain West and much above average across the eastern U.S., while most of the Plains saw near-average conditions. Virginia and West Virginia each tied their warmest July on record, while all Atlantic coastal states from Florida to Delaware saw temperatures that ranked among their four warmest. Warmth during the overnight hours was especially notable, with record-warm average minimum temperatures in 12 states spanning the Southeast, Mid-Atlantic and Ohio Valley.
Alaska’s average temperature for July was 55.3°F, 2.6°F above the 1925–2000 average, ranking in the warmest third of the 101-year record. Much of the state, particularly the North Slope, saw above-average temperatures. Hawaiʻi’s average temperature was 69.3°F, 0.5°F above the 1991–2020 average, placing it in the middle third of the 35-year record.
For the year to date (January–July), the CONUS averaged 53.3°F, 2.0°F above average, also ranking in the warmest third of the historical record. Temperatures were above average across most of the country, with several states in the West and Southeast much above average. Alaska’s year-to-date average temperature was 30.9°F, 5.1°F above average, marking its fourth-warmest January–July on record. Hawaiʻi tied its warmest January–July period on record, with an average temperature of 66.3°F.
Precipitation
The average precipitation for the CONUS in July was 3.00 inches, 0.22 inch above the 20th-century average, ranking in the wettest third of the 131-year record. July featured a patchwork of wet and dry conditions across the country. Below-average rainfall was observed in the Southwest, Great Basin and central Rockies, as well as much of the Southeast and Northeast. In contrast, above-average precipitation occurred across parts of the Plains, the middle and upper Mississippi Valley and portions of the Ohio Valley and Mid-Atlantic. Highlighting this variation, Utah experienced its second-driest July on record, while Iowa recorded its second wettest.
Alaska averaged 2.75 inches of precipitation for the month, 0.53 inch below the 1925–2000 average, placing it in the driest third of the 101-year record. Much of the state received below-normal precipitation. Hawaiʻi received 3.06 inches, 1.58 inches below the 1991–2020 average, also ranking in the driest third of its 35-year record.
The January–July precipitation total for the CONUS was 18.81 inches, 0.73 inch above the long-term average. Precipitation was below average across most of the West, while much of the Plains and Mississippi and Ohio Valleys were above average for the year to date. Alaska recorded 19.37 inches of precipitation from January through July, 2.46 inches above average, ranking in the wettest third of its 101-year record. Hawaiʻi received 25.24 inches over the same period, 9.15 inches below average, placing it in the driest third of its 35-year record.
Drought
According to the July 29 U.S. Drought Monitor report, about 31.0% of the contiguous U.S. was in drought, a decrease of approximately 1.4% since the beginning of the month. Drought persisted across much of the western CONUS, continuing to expand or intensify in the Northwest and central Rockies. Drought contracted or was reduced in intensity across parts of the Plains, the upper Mississippi Valley and the Florida Peninsula.
Notable Flooding Events
In July, the National Weather Service issued 1,434 flash flood warnings and 17 flash flood emergencies across the nation. Major flooding events included the following:
- July 4–7: The Texas Hill Country endured one of the deadliest flash floods in state history, with at least 135 fatalities. A rapidly moving mesoscale convective complex—fueled by moisture from Tropical Storm Barry’s remnants—dumped up to 20 inches of rain, triggering catastrophic flooding along the Guadalupe River.
- July 5–7: The remnants of Tropical Storm Chantal stalled over central North Carolina, delivering 8–12 inches of rain. The resulting flooding led to multiple rescues and three fatalities in Chatham County.
- July 8: Heavy monsoon rain over burn scars near Ruidoso, New Mexico, triggered flash flooding that killed three people, destroyed multiple homes and prompted over 80 water rescues. The Rio Ruidoso crested at a record 20.2 feet.
- July 8: In Chicago, more than 5 inches fell near the United Center in just 90 minutes, flooding viaducts and prompting water rescues.
- July 14–15: A slow-moving storm system dropped 3–6+ inches of rain across parts of New Jersey and the New York City metropolitan area, including more than 2 inches in one hour in Central Park—a July record. Flash flooding caused two deaths in New Jersey and prompted states of emergency in both states.
- July 24–25: Severe storms brought damaging winds and up to 6 inches of rain in under 90 minutes, triggering widespread flooding across Chicago.
- July 31: A rapidly developing convective system along the I-95 corridor brought rainfall rates exceeding 2 inches per hour, with up to 5 inches in New York City and 7 inches in parts of New Jersey. Flash flooding once again prompted emergency declarations in both states.
Monthly Outlook
Above-average temperatures are favored across much of the West and East, with increased likelihood over the Southwest and central Rockies, the Florida Peninsula and the far Northeast. Precipitation is likely to be below average from West Texas through the central and southern Rockies into the Four Corners area, while much of the Southeast is expected to experience above-average rainfall. In Alaska, warmer and wetter-than-average conditions are favored in the southeast, in contrast to below-average precipitation expected in the northwest. Drought is expected to persist across much of the western third of the country and in some areas of the Plains. Visit the Climate Prediction Center’s Official 30-Day Forecasts and U.S. Monthly Drought Outlook website for more details.
Significant wildland fire potential for August is above normal across much of the West and Hawaiʻi, and parts of north-central Texas and Oklahoma. For additional information on wildland fire potential, visit the National Interagency Fire Center’s One-Month Wildland Fire Outlook.
For more detailed climate information, check out our comprehensive July 2025 U.S. Climate Report scheduled for release on August 13, 2025. For additional information on the statistics provided here, visit the Climate at a Glance and National Maps webpages.
Here are more “ET’s” recorded from around the planet the last couple of days, their consequences, and some extreme temperature outlooks, as well as any extreme precipitation reports:
Here is More Climate News from Sunday:
(As usual, this will be a fluid post in which more information gets added during the day as it crosses my radar, crediting all who have put it on-line. Items will be archived on this site for posterity. In most instances click on the pictures of each tweet to see each article. The most noteworthy items will be listed first.)