The main purpose of this ongoing blog will be to track planetary extreme, or record temperatures related to climate change. Any reports I see of ETs will be listed below the main topic of the day. I’ll refer to extreme or record temperatures as ETs (not extraterrestrials).😜
Here is a new feature for this blog, which I will add daily. This is the latest inciteful Green News Report from my friends Desi Doyen and Brad Friedman at Progressive Voices. Hit ‘continue reading,’ listen, then hit return to see my daily topics:

Green News Report with Brad Friedman & Desi Doyen
Episode: 9/8/2026 — More info…
Main Topic: The Climate Lottery- Fall 2026 Contest
Dear Diary. It’s time for a little fun by playing my contest held once per season.
The Climate Lottery is a forecast contest free to play by giving your picks in an e-mail or in this post’s comment section. No prizes will be given out for the contest, which is for educational purposes only. The main purpose for the contest is to get climate change conscious people interested in National Center for Environmental Information climate products. The special account that I have set up for the contest is guywalton94@gmail.com. This time I will make a personal pick, following along with any players.
I’m getting all of my information for every Climate Lottery contest here, which I hope you will refer to often:
National Maps | National Centers for Environmental Information (NCEI) (noaa.gov)
The National Center for Environmental Information ranking numbers for average temperatures of the lower 48 states for Fall 2026 will be posted on or shortly after December 8th, 2026, which will be the official “Climate Lottery” numbers of the contest. Any subsequent changes by NCEI after their initial posted rankings will not be valid for the contest…but those ranking numbers will change with time.
The winning Climate Lottery numbers for Summer 2026 (SEP, OCT, NOV) were 115/132/132 with a Power Ball number of 132 for the season, meaning that the Summer 2026 was the hottest Summer in recorded history for the lower 48 states in the United States.
Hello again to all weather and climate geeks out there. Summer 2026 turned out to be warmest and the 132nd coolest summer on record for most of the United States since measurements for that statistic have been kept in 1895. If you wish to play “The Climate Lottery,” pick one number between 1 and 132 (with 1 representing the coldest possible ranking and 132 being the highest possible ranking) for September, October and November. Also, pick a “Power Ball” or overall ranking number for the fall season as a whole between 1 and 132. The Power Ball ranking will serve as a tiebreaker for any close picks between contestants. Your picks are NCEI rankings for average temperatures across the lower 48 states. Because 2026 will be the 132nd year that the National Center for Environmental Information has been ranking years since 1895, all months and seasons for 2026 will have a potential warmest ranking of 132.
Please give your picks at guywalton94@Gmail.com or in the comments section at the end of this post before October 5th, 2026. If you wait until just before October 5th to make your picks, you can make an educated guess as to what the ranking for September will be and also have a heads-up guess for October.
The Power Ball (or overall National Center for Environment Information) number for Summer 2026 for the lower 48 states was 132, which was the warmest ranking possible for the lower 48 states. I’ve defined individual lottery numbers as a ranking for each month for the lower 48 states, Power Ball numbers as those for each season, and Mega Ball numbers as those for each year. The Mega Ball number for 2025 was 128, meaning that 2025 was the 4th warmest year on record for the lower 48 states.
Chances for an entire season of below average temperatures are becoming much less likely across the lower 48 states due to carbon pollution. The whole point of these posts is to demonstrate how skewed temperatures have become towards warmth due to climate change and to get people to look at NCEI data. Of course, as far as the globe goes, the larger an area that is compared to average, the more likely that area is to be above long-term averages. What has happened this decade is yet more proof of the Climate Lottery game being loaded for warmth in the United States. Balls coming out of the Climate Lottery hopper are likely to have high numbers. But not every month is at a record warm level, so observational forecasting is key to the game.
Charts used below can be found here (Unfortunately, NCEI is having some problems, so not all maps are properly displayed. I will make proper updates soon once NCEI issues are settled):
https://www.ncei.noaa.gov/access/monitoring/us-maps
Here’s a breakdown of the National Climatic Center’s ranking numbers by state for Summer 2026, which was ranked at warmest or 132nd coldest (or a Powerball ranking of 132):
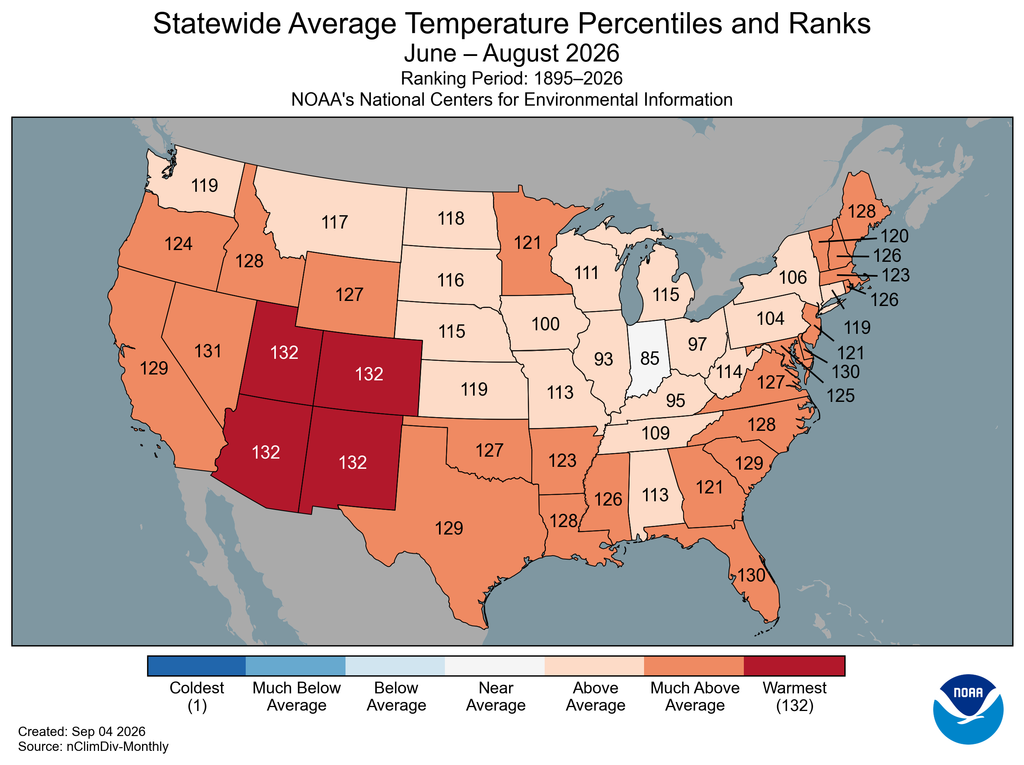
Overall, Summer 2026 was at record warmest levels for much of the West while the Midwestern states saw slightly cooler average conditions, but there were no below average states.
The following is a breakdown of each month for Summer 2026. Each chart shows “Climate Lottery” numbers for each state (or rankings) from a scale of 1 to 132.
In June the overall ranking for the lower 48 states was 115 (Out of from 1 to 132):
Summer started out exceptionally hot relative to average across all of the West:
June 2026 saw the coolest conditions relative to average for all three summer months.
In July the overall ranking for the lower 48 states was 132 (out of from 1 to 132):
In August the overall ranking for the lower 48 states was also 132 (out of from 1 to 132):
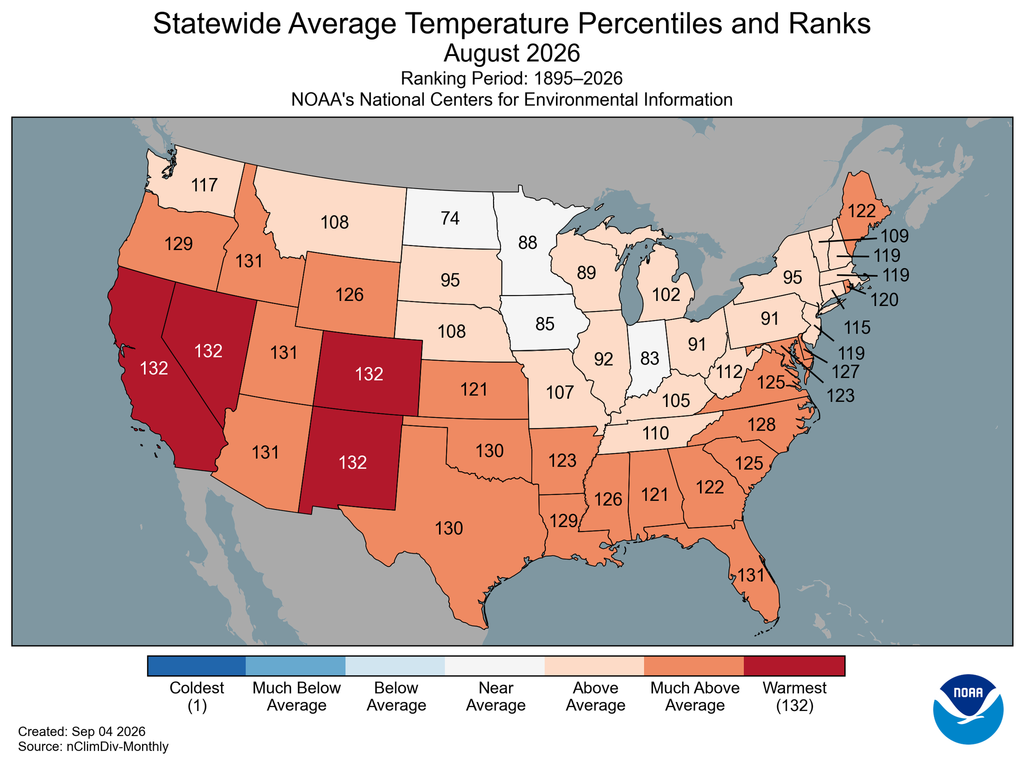
August was another record hottest month with the core of record heat centered over the Southwest.
The following are the rankings, so far, for individual months or “Climate Lottery number picks” from 2016-2026:
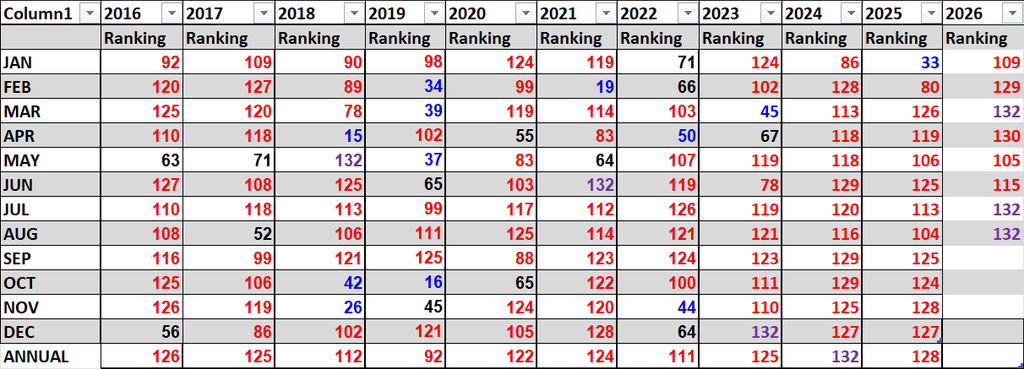
The average ranking for 2026 is 66 since the coldest ranking would be 1 and the hottest 132. I have color coded all well below average temperature rankings for this post at or below 55 blue and all those above temperature rankings at or above 77 red, with rankings + or – 10 from the mean value of 66 black for near average temperature rankings. Record warmest months are highlighted in purple. With time, the rankings for each individual month, season and year will change as more data becomes available from NCEI. Also, for reference, the annual or “Mega Ball” numbers are shown on the chart. For example, the Mega Ball number for 2022 was 111, meaning that 2022 was the twentieth warmest year on record for the lower 48 states.
Seasonal or Power Ball rankings for winter are those for DEC/JAN/FEB, spring are MAR/APR/MAY, summer JUN/JUL/AUG, and fall SEP/OCT/NOV. Mega Ball rankings for each year are included on the chart below. Also, keep in mind that NCEI rankings for seasons are not merely an average of rankings of individual month of a season or year, as was the case for Summer 2026- 115/132/132 P.B. 132:

Notice that since the start of 2016 only three out of the last forty-three seasons were near average or “black.” No season was below average or colored blue. Forty out of the last forty-three seasons since 2016 have been “red” or “purple,” being above average. Summer 2026 definitely adds to our warm stats and was also colored red. Indeed, the Climate Lottery hopper is very much loaded for above average temperatures for the lower 48 states looking at recent history. Yes, the “Casino of Climate Averages” is cheating causing the “House of Warming” to win just about every new season due to carbon pollution.
I hope that everyone will have a great, safe fall.
Guy Walton…”The Climate Guy”
Here are some “ETs” recorded from around the U.S. the last couple of days, their consequences, and some extreme temperature outlooks, as well as any extreme precipitation reports:
Here is More Climate News from Thursday:
(As usual, this will be a fluid post in which more information gets added during the day as it crosses my radar, crediting all who have put it on-line. Items will be archived on this site for posterity. In most instances click on the pictures of each tweet to see each article. The most noteworthy items will be listed first.)