Thursday April 12th… Dear Diary. The main purpose of this ongoing post will be to track United States extreme or record temperatures related to climate change. Any reports I see of ETs will be listed below the main topic of the day. I’ll refer to extreme or record temperatures as ETs (not extraterrestrials)😊. Here is today’s main climate change related topic:
Alaskan Record Trends
I’ve never investigated record count trends on a state level before until now even though the NCEI tool for doing so has been available for a few years. If anyone wants to do so numbers can be crunched down to a county level. So where to start? I chose Alaska since a) it is large and isolated away from the lower 48 states b) I wanted to help prove that areas closer to the pole are warming faster than those at lower latitudes as other climate scientists are finding, and c) in the future I or someone might want to subtract Alaskan counts from U.S. counts to get a better statistical handle on lower 48 state trends. The following is an end result of weeks of plugging in record numbers to the same Excel Files I use for the U.S. and other countries:
First let’s compare record counts (including tied records) per decade:


Same song same dance right? Not exactly. As I’ve stated many times I’m interested in the more subtle aspects of charts. Both show mid 20th century cooling with some differences from the 1940s-1960s and the warming trend since 1980; however, as we have seen on Russian and Canadian charts ratios for Alaska are higher.
Now let’s look at numbers making up these two charts. I didn’t separate the Alaskan data from the U.S. data for this post. Alaskan record counts are included in the U.S. (50 states and territories counts).


First I found that record counts fall substantially for the U.S. as a whole prior to 1922 and in Alaska prior to 1929, so we should discount any trends in Alaska for the 1920s. Keep in mind that a count doesn’t get registered unless a station like Fairbanks has been reporting continuously for 30 years. Alaska might be large, but it has relatively few reporting stations being part of what is left of the cold, untamed West.
Alaska just like the lower 48 states had an exceptionally warm period after the last strong El Nino started in late 2014 (Alaska temperature rankings start with the year 1925, so I will fill in the blanks below soon.):

*From December 2015- April 2016 no daily record lows were set, a phenomenon not seen at all in the NCEI data since 1929 for a three month period much less than a five month period.*…An important finding.
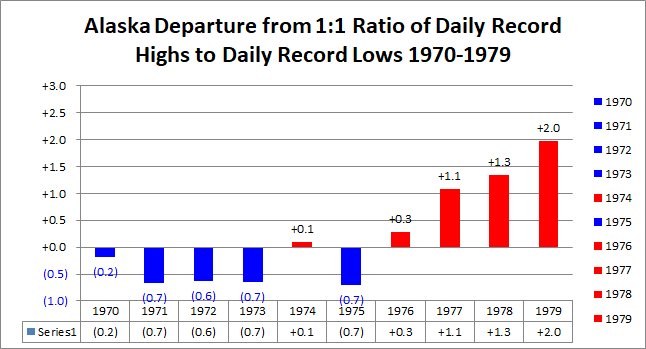
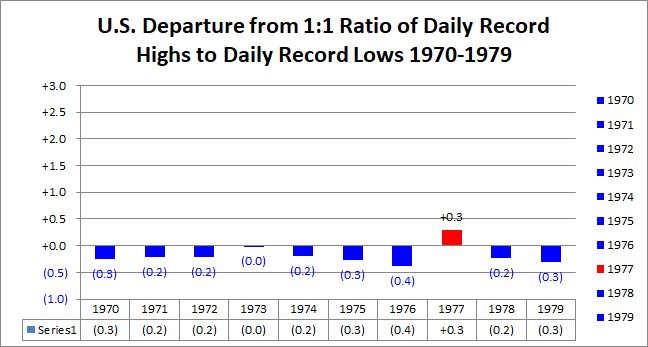
I found that, as might be expected, Alaska started its warming AGW related warming trend faster during the 1970s:
Looks like #Alaska, and thus? higher latitudes began to warm faster than lower latitudes due to #AGW.


 Radiant Solutions | Weather Desk @Radiant_Weather
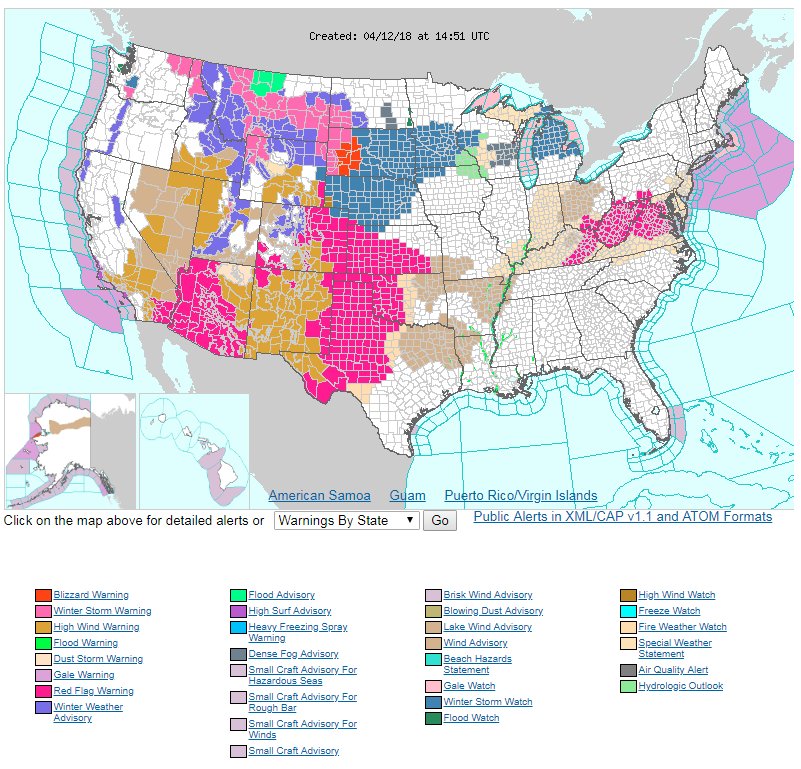
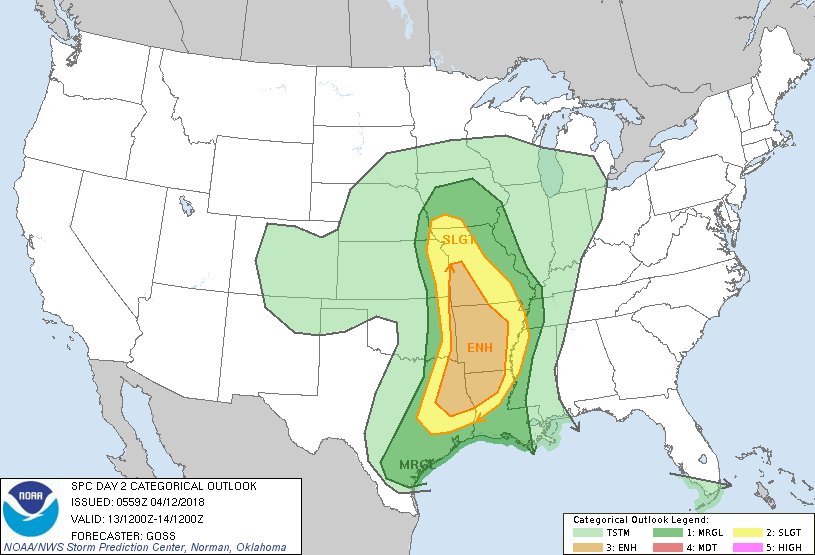
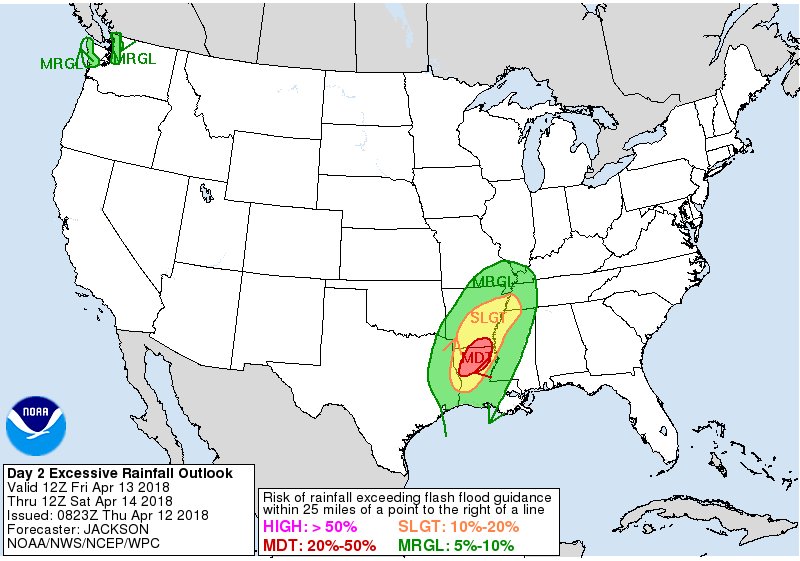
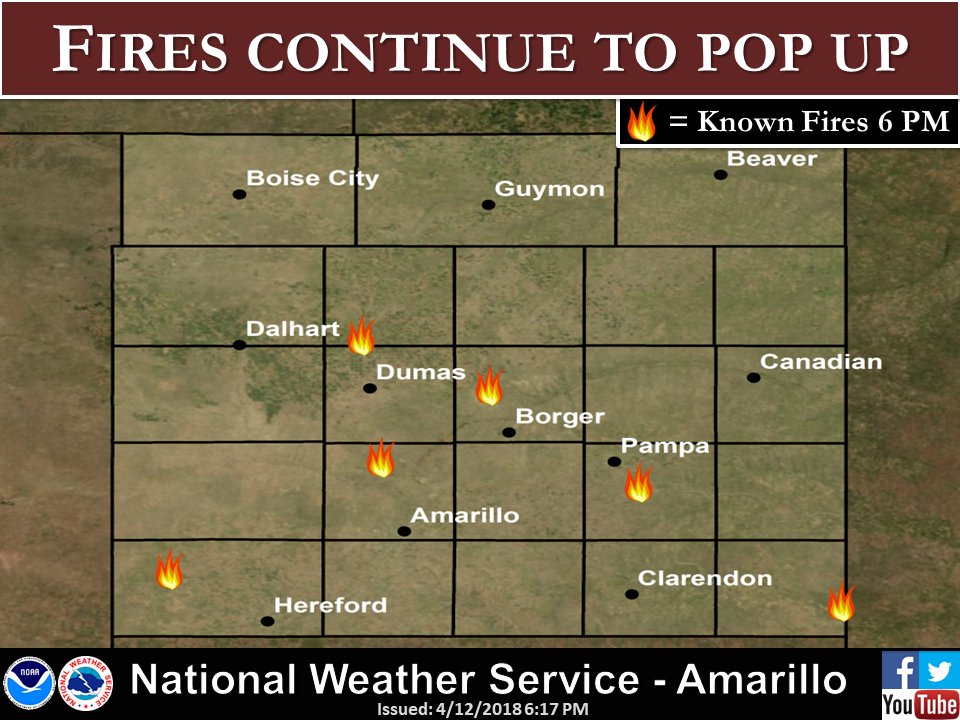
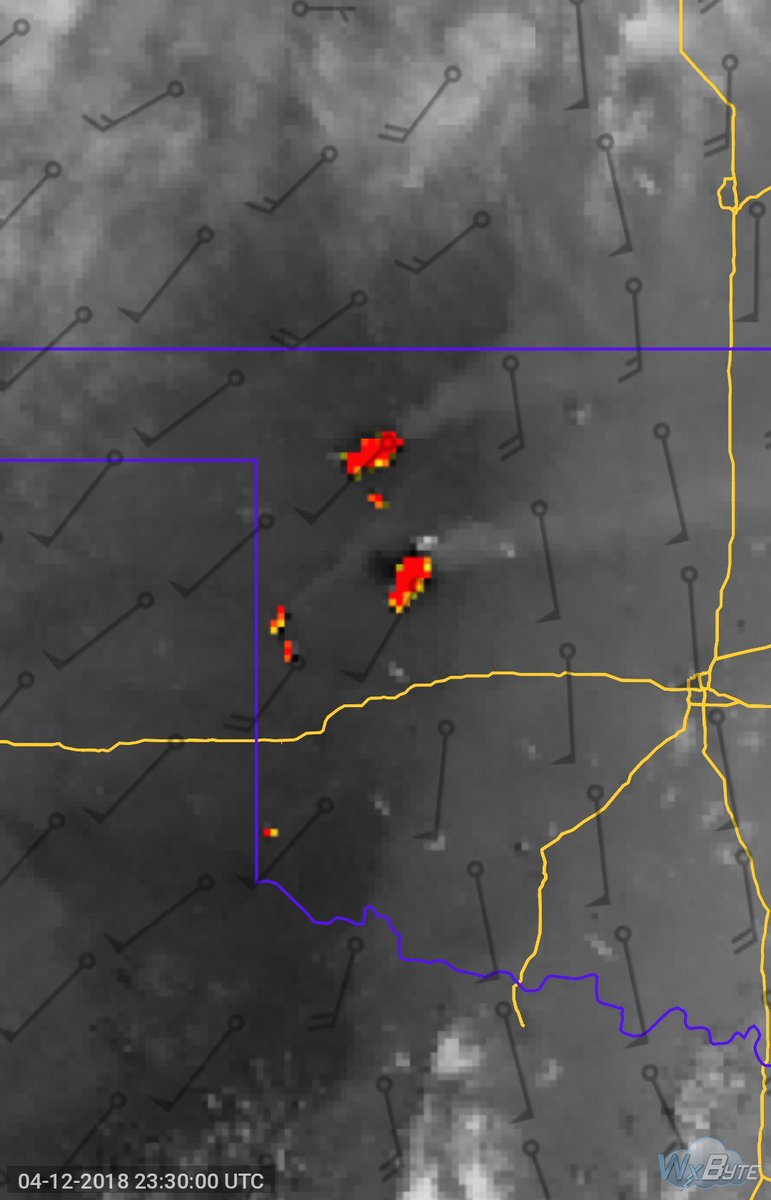
Massive #wildfire outbreak ongoing across NW #Oklahoma as seen from @WxByte http://satsquatch.com 3.9 micron infared. Fires being fuled by strong winds and very dry conditions. #okfire #okwx #txwx
(If you like these posts and my work please contribute via the PayPal widget, which has recently been added to this site. Thanks in advance for any support.)
The Climate Guy


