Monday August 13th… Dear Diary. The main purpose of this ongoing post will be to track United States extreme or record temperatures related to climate change. Any reports I see of ETs will be listed below the main topic of the day. I’ll refer to extreme or record temperatures as ETs (not extraterrestrials)😊. Here is today’s main climate change related topic:
Early August “Record Scoreboard” Update
This evening I’m going to take a break from writing tipping point posts to present NCEI record count and average temperature trends for the lower 48 states.
Around the tenth of each month I have started the habit of presenting my ” NCEI record count scoreboard” and presenting temperature trends for the rest of the month, which I will present on this post for June 2018. I’m like a laundry machine on wash, rinse, repeat mode.😉
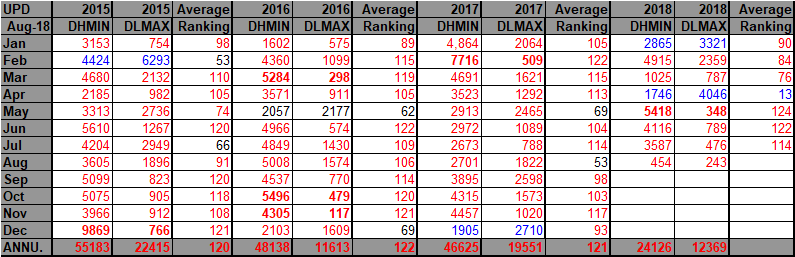
First, let’s look at that scoreboard of counts of National Center for Environmental Information daily high maximum and low minimum records (updated through 8/7):

For this data set all monthly ratios of > 10 to 1 DHMX to DLMN or > 10 to 1 DLMN to DHMX are in bold type. The rankings are for the lower 48 states with the warmest ranking since 1895 of average temperatures being 124 and 1 being the coldest as of 2018. Blue colors represent cold months and red warm. Those months with counts close to a 1 to 1 ratio of highs to lows are colored black.
Since presenting this chart last time I’ve added the ranking of 114 for July 2018, yet another hot ranking in the top 20 for the lower 48 states. Notice that so far we have not had a bold, red month for this summer. Thankfully, I doubt we will see August 2018 have a dreaded 10-1 ratio of DHMX to DLMN looking at the weather pattern through the end of the month. Still, record heat has continued to blister the West from time to time this month greatly exacerbating conflagrations exploding there. Where have most of the 160 and counting daily record lows come from? Surprisingly from the great state of Texas in the wake of a cold front from the 1st through the 5th. We will see many reports of record highs set after the 7th in the West and northern Plains once those counts make their way into the system.
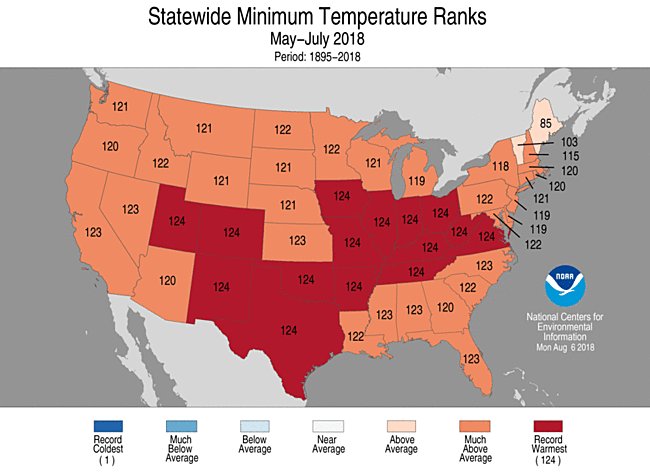
Climatologically July 2018 joins a long list of months since January 2015 of above average temperatures across the lower 48 states. Only 3 months out of 42 have ranked below the average ranking of 62 (half of 124) since JAN 2015, (FEB 2015, AUG 2016 and APR 2018). Only two months since JAN 2015 have seen more daily record lows than highs, (JAN 2018 and APR 2018). Most alarming of all:

The U.S. Just experienced its warmest May-July according to @NOAANCEIclimate. During that time a whopping 13,111 daily U.S. record high minimums have been recorded, so far. Nights are warming faster than days. #ClimateChangeIsReal
(As usual, this will be a fluid post in which more information gets added during the day as it crosses my radar, crediting all who have put it on-line.)
Here is some of today’s climate related news:
 Frances Sinclair @francessinclai5

 Bill McKibbenVerified account @billmckibben


 Allan Margolin @AllanMargolin

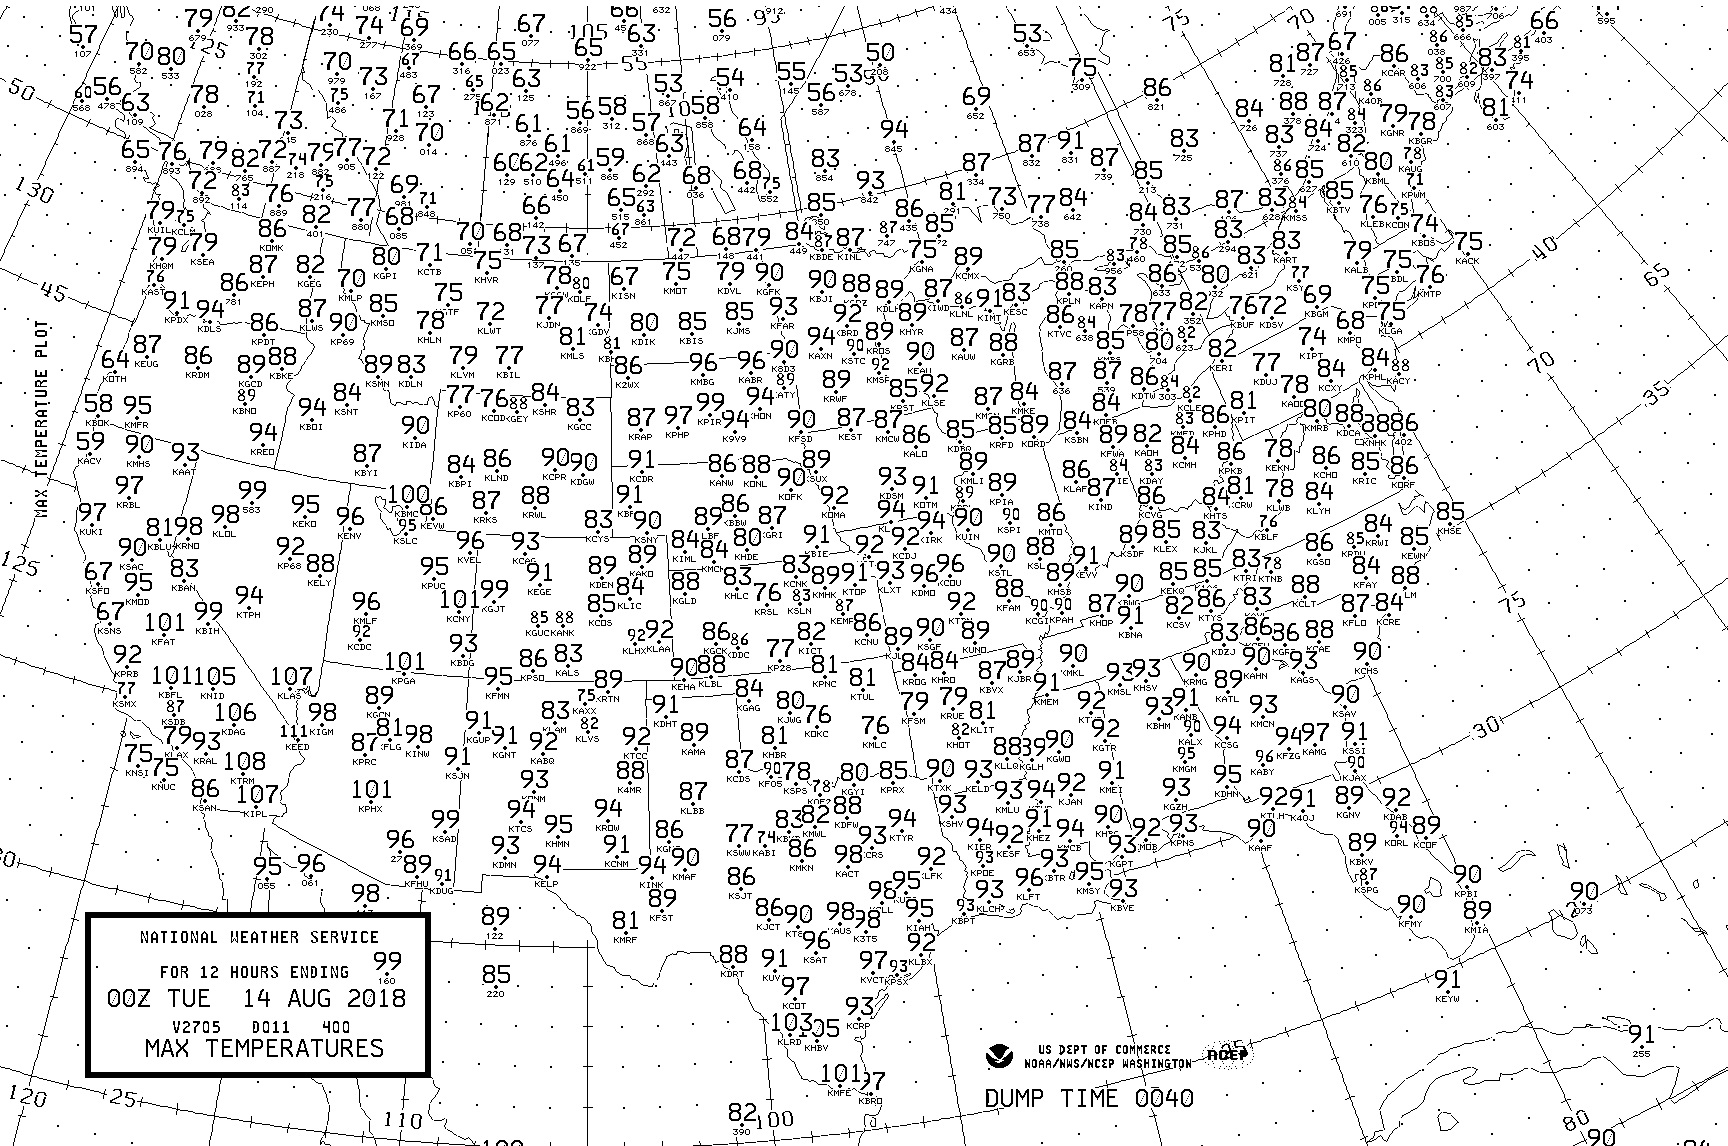
This is the most averaging looking chart I have seen in quite some time from coast to coast. The last vestiges of the heat wave in the northern Plains were in South Dakota where most maxes were above 90F.
(If you like these posts and my work please contribute via the PayPal widget, which has recently been added to this site. Thanks in advance for any support.)
The Climate Guy