Tuesday August 14th… Dear Diary. The main purpose of this ongoing post will be to track United States extreme or record temperatures related to climate change. Any reports I see of ETs will be listed below the main topic of the day. I’ll refer to extreme or record temperatures as ETs (not extraterrestrials)😊. Here is today’s main climate change related topic:
Tipping Point Discussion…Part 5) El Nino Southern Oscillation
(As usual, this will be a fluid post in which more information gets added during the day as it crosses my radar, crediting all who have put it on-line.)
To begin today’s discussion for reference here is that global tipping point chart by Dr. Steffen indicating roughly at what global average temperature above preindustrial conditions cooling factors helping to regulate the climate become warming, thus spiking surface temperatures higher even if CO2 pollution ceased:
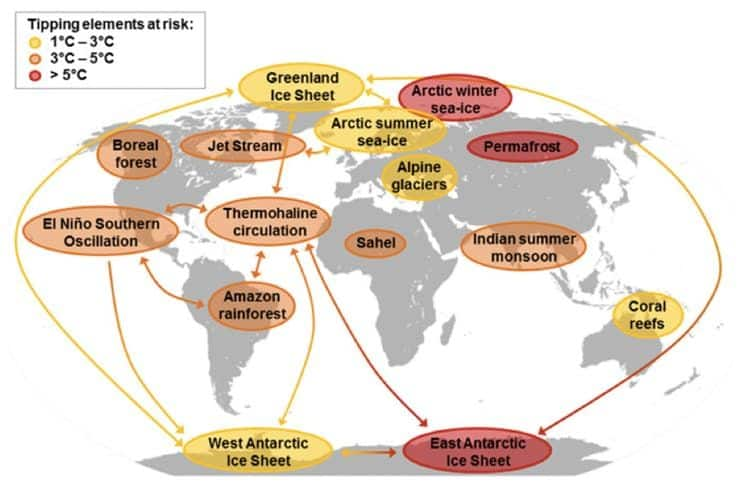
(Global map by Will Steffen of potential tipping cascades. The individual tipping elements are color- coded according to estimated thresholds in global average surface temperature (tipping points) (12, 34). Arrows show the potential interactions among the tipping elements based on expert elicitation that could generate cascades. Note that, although the risk for tipping (loss of) the East Antarctic Ice Sheet is proposed at >5 °C, some marine-based sectors in East Antarctica may be vulnerable at lower temperatures.) From: http://www.pnas.org/content/early/2018/08/07/1810141115#ref-12
On this site I’ve written a prior posts, which carefully looked at U.S. surface record temperature trends in conjunction with the last two “super strong” El Nino events in 2016 and 1998:
Here are some points from my last post on El Ninos:
I’d like to point out as a bit of a warning to my climate science friends and all reading that contrarians will point to a period after a peak or spike on charts, suggesting that there is no warming trend or that a “global cool down is imminent.” I saw this play out last decade after the record El Nino of 1998, and it may happen again after the strong El Nino of 2016. How often did I read “global warming has stopped since 1998?” Global temperature average trends on charts may not rise very much or might even go down slightly the next few years after 2016. This doesn’t mean that global warming has halted, just that averages are bound to come down some after a strong El Nino ends.
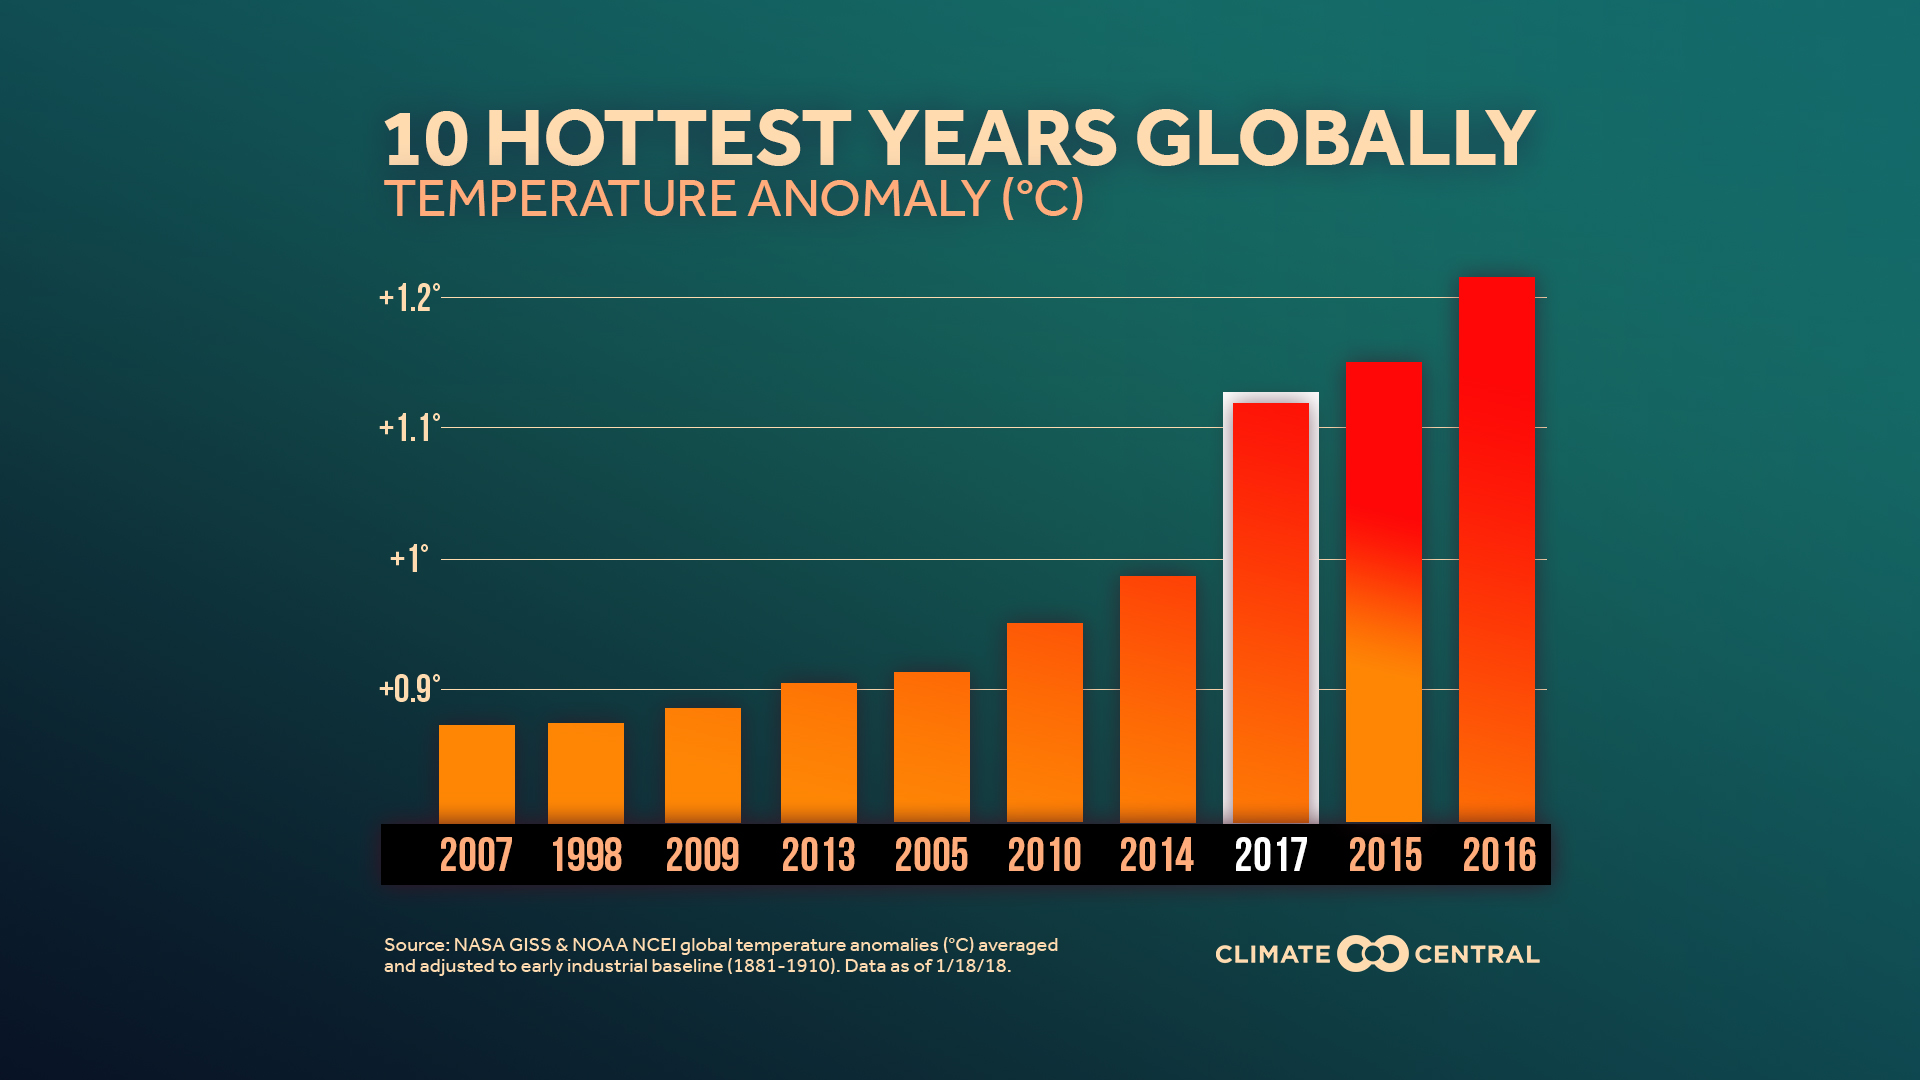
The last three near record strong El Ninos occurred in 1983, 1998, and 2016 with roughly 15 years between the big events. Looking at this trend we may not see another whopper of an El Nino until about the year 2031. Once another strong El Nino occurs we are likely to see another huge spike in global average temps just like in 1998 and 2016 with a new yearly record being set pretty far above prior years. Will global warming end between now and that future year? Of course not unless there is a big uptick in volcanic activity. To get a good idea how anomalously warm the next record hot year might be during a strong El Nino year we can compare 1998 with 2016. Looking at this Climate Central bar graph it’s apparent that 1998 is hanging on as the last year from the 20th century ranked on this top ten chart:
I spied this graph made by climate scientist Stefan Rahmstorf (not to be confused with Will Stefen), which nicely how much warmer the world was in 2016 compared with 1998:

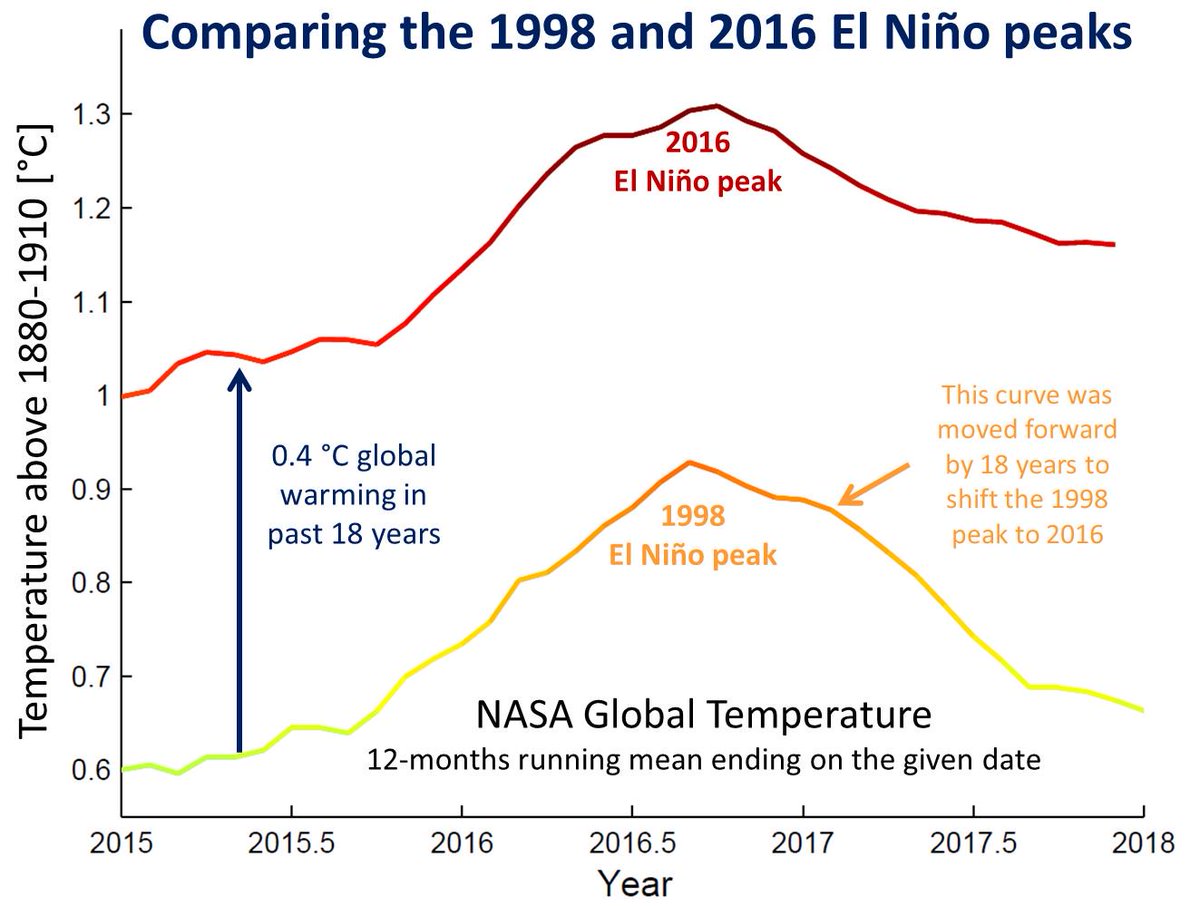
Well, all we have to do to predict what the global average might be in about 15 years when the next peak should occur from another strong El Nino is to tack on another +.4C to the +1.3C from 2016 getting +1.7C. Remember that global temperatures are not recommended to exceed +2.0C above preindustrial levels, so the human race has precious little time to get its carbon polluting house in order. Of course there may be a few factors coming into play upsetting the old apple cart of this rough forecast.
God forbid that strong El Ninos start occurring at shorter intervals, which would exponentially spike averages. I’ve come to the conclusion that El Ninos are like giant pressure release valves…when turned on they release excess heat built up within the oceans. The imbalance of radiation due to global warming may cause El Ninos to occur longer and at shorter intervals between episodes. For more thoughts and data on El Ninos and how they affect temperature records in the United States read my second post from last year: https://guyonclimate.com/2017/01/20/el-ninos-ramping-up-the-heat/
This last paragraph is what I think Dr. Stephen had in mind in his group’s paper forecasting El Ninos to become a net heat producer once global averages exceed +3C to +5C above preindustrial conditions. Once ocean temperatures warm enough nature will use its “giant pressure valve release” more often. El Ninos should become more frequent and stronger while La Nina cooling events become weaker and less frequent. We all know how disruptive strong El Ninos are for planetary weather. An El Nino event is forecast for this fall, but I doubt that it will rival that of 2016. Again, if global averages are kept below +2C above preindustrial conditions monster El Ninos, far worse than anything experienced in human history, can be avoided.
..……………………………………………………………………………………
On Wednesday temperatures will be similar to those of Tuesday with the most anomalous warmth remaining in the West. In the wake of a system producing flooding across the Northeast maxes will be warmer with low 90s making an appearance across the Megalopolis zone.

……………………………………………………………….
Here is some of today’s climate related news:
 Kelly McCusker @kellyclimatedr
Neat graphic! At: https://twitter.com/rarohde/status/1029381299730100225
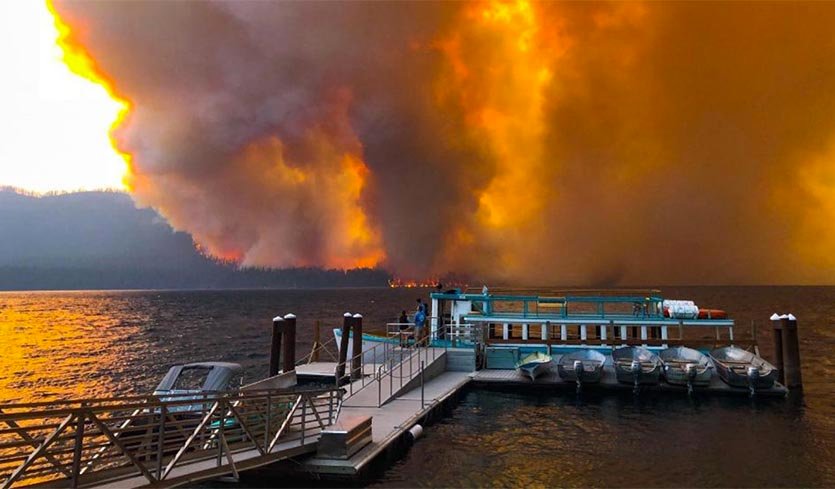
 Eric HolthausVerified account @EricHolthaus
Now, it’s on fire and partially evacuated.
Here’s the story:
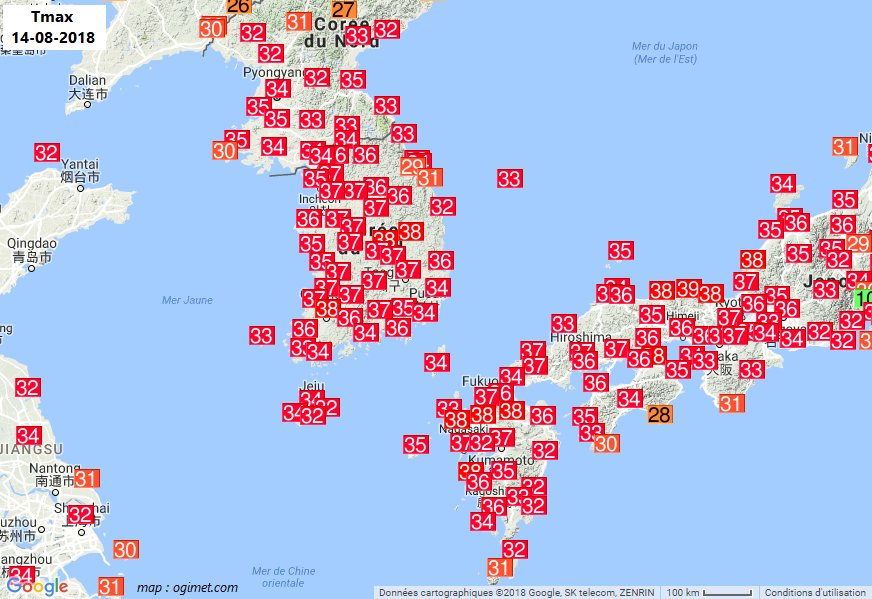
Verified account @wunderground


#SouthKorea
38.9°C Jeonju (ancien 38.6 en 1930)
38.4 Sangju
37.3 Imsil
#Japan
39.9°C Hita (ancien 39.4 en 2013)
39.5 Kurume
39.0 Ureshino
…
(non exhaustif)
Still very hot between South Korea and South West Japan, some absolute records these 13 and 14 August #heatwave #SouthKorea 🇰🇷 38.9 °c Jeonju (former 38.6 en 1930) 38.4 Sangju 37.3 Imsil #Japan 🇯🇵 39.9 °c Hita (former 39.4 en 2013) 39.5 Kurume 39.0 Ureshino…
(Non-exhaustive)
(If you like these posts and my work please contribute via the PayPal widget, which has recently been added to this site. Thanks in advance for any support.)
The Climate Guy