Wednesday November 6th… Dear Diary. The main purpose of this ongoing blog will be to track United States extreme or record temperatures related to climate change. Any reports I see of ETs will be listed below the main topic of the day. I’ll refer to extreme or record temperatures as ETs (not extraterrestrials).😉
October and Early November Record Scoreboards and Climatological Review
As promised from yesterday I would present my “Record Scoreboards” after the National Center for Environmental Information released their monthly report, which they have done so today. Here on this site we present these summaries monthly near the 6th or 7th of each month if you want to go back through my Extreme Temperature Diary archive. Noted by weather historian Chris Burt as presented on yesterday’s Diary, October 2019 took the proverbial cake as far as extreme records go, and today’s average temperature charts from NCEI bear that phenomena out.
October 2019 saw many extremely hot records in the East and South to begin the month. There were two big cold waves in the West, one early in the month and one at the end. The latter was cold enough to produce 66 all-time low records. October historically has not been a month in which all-time records are set. The extent of the two cold outbreaks far surpassed that of the early October historic heat wave, so for a change, even though the world is warming overall, the U.S. had below average temperatures.
October 2019 got ranked by the National Center for Environmental Information as a well below average October, temperature wise, for the lower 48 states coming in as 21st coldest or 105th warmest since records began being kept in 1895.
https://www.ncdc.noaa.gov/sotc/national/201909
Here we see rankings for each state in the contiguous United States:
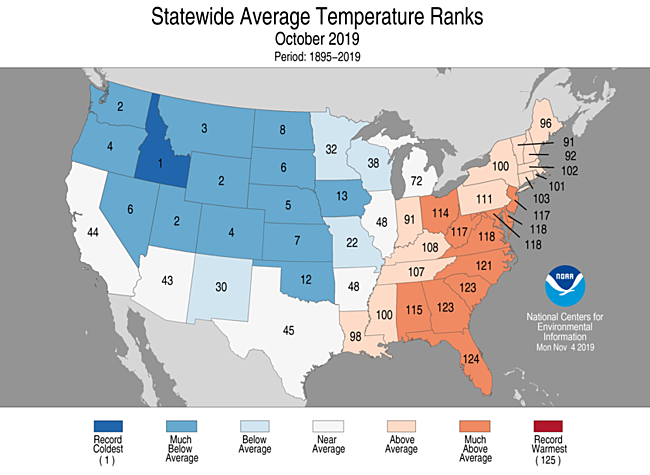
Florida saw its second warmest October. In stark contrast Washington, Wyoming and Utah had their second coldest Octobers with Idaho taking top honors at number one.
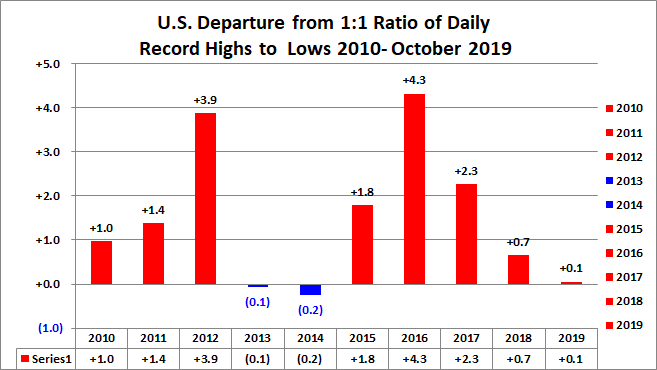
Here are my two U.S. Daily Record Scoreboards updated through 11/3/2019 (data compiled from the following NCEI site):
https://www.ncdc.noaa.gov/cdo-web/datatools/records


For these data sets all monthly ratios of > 10 to 1 DHMX to DLMN or > 10 to 1 DLMN to DHMX are in bold type. The rankings are for the lower 48 states with the warmest ranking since 1895 of average temperatures being 125 and 1 being the coldest as of 2019. Blue colors represent cold months and red warm. Those months and years with counts close to a 1 to 1 ratio of highs to lows are colored black. Boldly colored months, such as May 2018, have ratios of more than 10 to 1 daily record highs to lows or lows to highs, and are either historically hot or cold, most of which have made news.
October 2019 had a near 3-5 ratio of record DHMX to DLMN individual record counts, so the color I used for this month was blue on the top chart.
October 2019 had a near 2-3 ratio of record DHMN to DLMX individual record counts, so the color I used for this month was blue on the bottom chart.
Due to climate change we will see less blue colors on these Record Scoreboards with time, but in the United States October 2019 was an exception.
The year 2019 has not been particularly warm, average temperature wise, across the United States either.
As stated, the ranking for the month was 21, which was colored blue. I color rankings +10 or -10 from the average ranking of 62 black indicating that these are near average temperature wise.
November 2019 has gotten off to cold start, as well, looking at record counts, and some really cold outbreaks forecast over the next week will skew averages fairly low.
So far, the U.S. has seen a near average 2019 looking at temperatures and record counts, but we may be experiencing one of the last “tolerable” years, temperature wise, in the face of global warming. Certainly we are beginning to see more extreme warmth, and yes chill. We will see if this chart changes much for 2019 through the end of this year:
For some elaboration on point three here is a link:
For more climate statistics read this linked Weather Underground piece:
So was it cold across the rest of the globe just like in the northwestern United States? Hardly:
In fact, the cold pocket across western North America is quite isolated looking at Copernicus charts.
Let’s add a link on moisture here too:
Speaking of Alaska:
November numbers and assessments should prove interesting, so stay tuned to this website for updates…like this:
Here is more climate and weather news from Wednesday:
(As usual, this will be a fluid post in which more information gets added during the day as it crosses my radar, crediting all who have put it on-line. Items will be archived on this site for posterity. In most instances click on the pictures of each tweet to see each article.)
(If you like these posts and my work please contribute via the PayPal widget, which has recently been added to this site. Thanks in advance for any support.)
Guy Walton- “The Climate Guy”