The main purpose of this ongoing blog will be to track planetary extreme or record temperatures related to climate change. Any reports I see of ETs will be listed below the main topic of the day. I’ll refer to extreme or record temperatures as ETs (not extraterrestrials).😉
Main Topic: Early April Record Scoreboard Update And Climatological Review
It’s time once again for our monthly climatological review. Here on this site we present monthly summaries near the 8th of each month, and each is available if you want to go back through my Extreme Temperature Diary archive. This report will be added to our climate summary and record scoreboard category on this site for these posts where you can check out reviews and statistics from prior months:
https://guyonclimate.com/category/record-scoreboard-climatological-reviews/
I’m repeating my mantra from prior months:
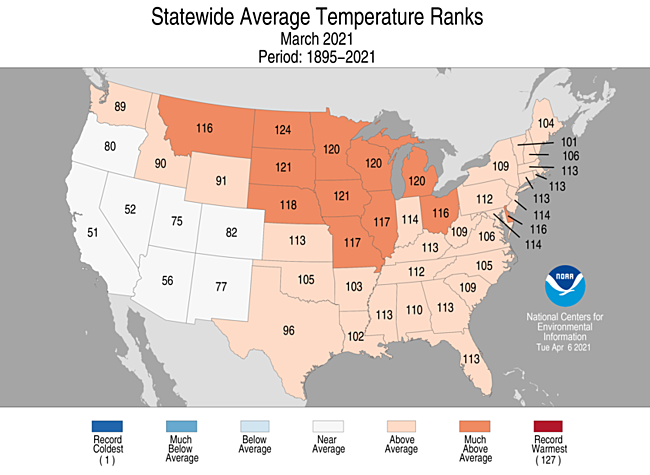
March 2021 got ranked by the National Center for Environmental Information as a well above average March, temperature wise, for the lower 48 states, coming in as the 14th warmest or 114th coldest since records began being kept in 1895:
https://www.ncdc.noaa.gov/cag/national/rankings
Record cold from February was short lived. The country thawed out rapidly during March with many states having above average conditions. The Midwest had the most anomalously warm conditions. Not one state had below average conditions:
Here are my two U.S. Daily Record Scoreboards updated through 4/08/2021 (data compiled from the following NCEI site):
https://www.ncdc.noaa.gov/cdo-web/datatools/records

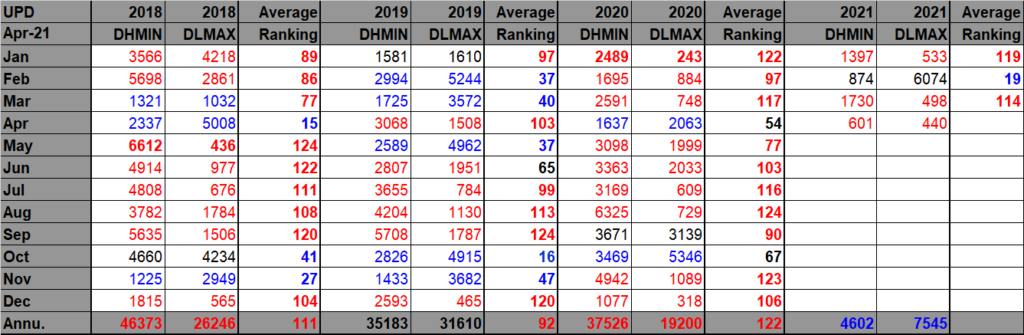
DHMX= Daily High Max Reports. DLMN= Daily Low Min Reports. DHMN= Daily High Min Reports. DLMX=Daily Low Max Reports.
For these data sets all monthly ratios of > 10 to 1 DHMX to DLMN or > 10 to 1 DLMN to DHMX are in bold type. The rankings are for the lower 48 states with the warmest ranking since 1895 of average temperatures being 126 and 1 being the coldest as of 2021. Blue colors represent cold months and red warm. Those months and years with counts close to a 1 to 1 ratio of highs to lows are colored black. Boldly colored months, such as January 2020, have ratios of more than 10 to 1 daily record highs to lows or lows to highs, and are either historically hot or cold, most of which have made news.
March 2021 had approximately an 17.5-5 ratio of record DHMX to DLMN individual record counts, so the color I used for this month was red on the top chart.
March 2021 had approximately a 17.5-5 ratio of record DHMN to DLMX individual record counts, so the color I used for this month was red on the bottom chart.
Due to climate change we are seeing less blue colors on these Record Scoreboards with time, and March 2021 was atypical for this trend.
As stated, the ranking for March 2021 was 114, which was colored red. I color rankings +10 or -10 from the average ranking of 63 black, indicating that these are near average temperature wise. Record statistics matched up well with the ranking of 114 for March 2021.
As shown on both charts, we can see that April 2021 has gotten off to a warm start, but we are seeing indications that this month will see some cold conditions in the Midwest starting this week, bringing down overall averages.
Here is much more detailed March 2021 U.S. climatology as complied by NOAA:
https://www.ncei.noaa.gov/news/national-climate-202103
Assessing the U.S. Climate in March 2021
February Cold Wave identified as the first billion-dollar disaster of 2021; contiguous U.S. experienced above-average temperatures during March

The Cold Wave that occurred across the central United States in mid-February has preliminary damage losses in excess of $10 billion. Texas experienced the majority of these losses, with costly impacts occurring in more than a dozen additional states. This event is the most costly winter storm event on record for the U.S., surpassing losses associated with the Superstorm of 1993.
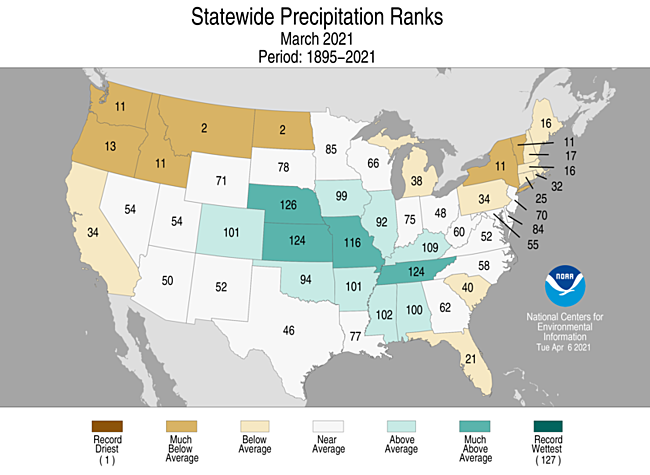
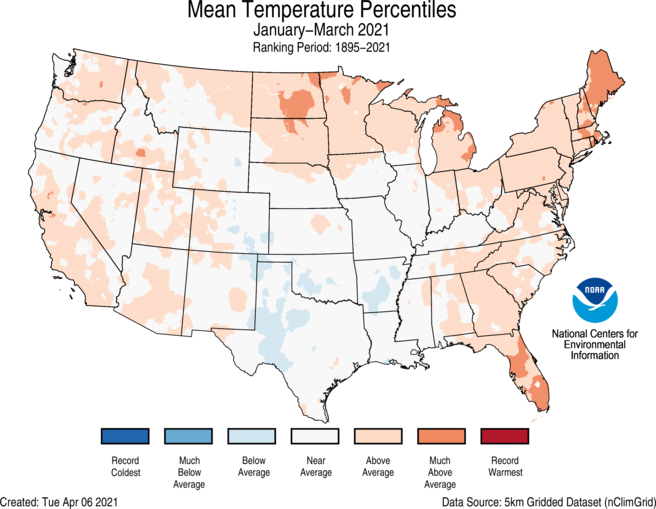
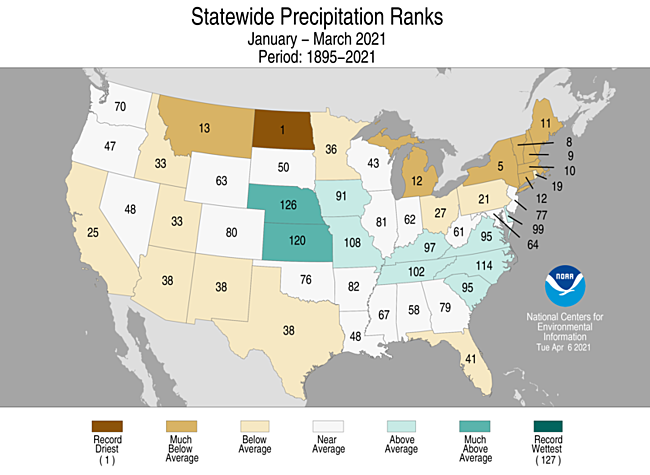
During March, the average contiguous U.S. temperature was 45.5°F, 4.0°F above the 20th-century average. This ranked in the warmest third of the 127-year period of record. The year-to-date (January-March) average contiguous U.S. temperature was 36.9°F, 1.8°F above average, also ranking in the warmest third of the record. The March precipitation total for the contiguous U.S. was 2.45 inches, 0.06 inch below average, and ranked in the middle third of the 127-year period of record. The year-to-date precipitation total was 6.55 inches, 0.41 inch above average, ranking in the middle third of the January-March record.

This monthly summary from NOAA National Centers for Environmental Information is part of the suite of climate services NOAA provides to government, business, academia and the public to support informed decision-making.

- Above-average temperatures were observed from the Northwest to the Great Lakes to the Gulf of Mexico and into the Northeast. Temperatures across North Dakota were fourth warmest on record. Below-average temperatures were present across parts of the West Coast during March.
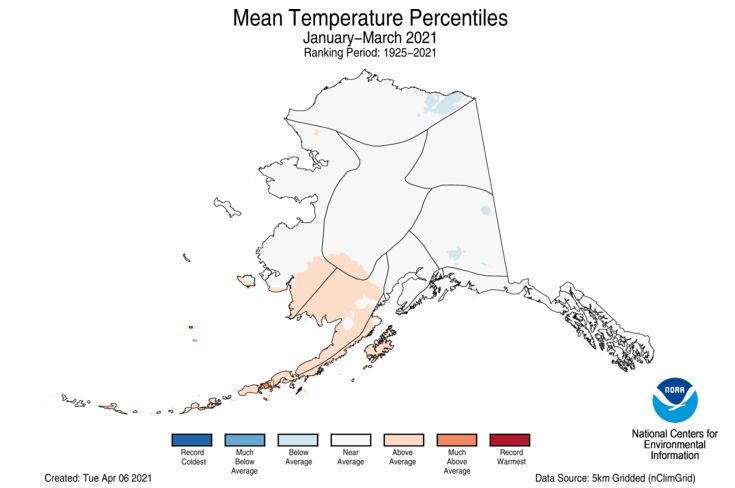
- The Alaska March temperature was 7.2°F, 3.6°F below the long-term average. This ranked in the coldest third of the 97-year period of record for the state and was the coldest March since 2017. On average, the coldest departures from average occurred across south-central Alaska while much of the North Slope was near average. Bering Sea ice extent was 81 percent of average for March, which contributed to above-average temperatures across the Aleutians.

Precipitation

- Above-average precipitation was observed from the central U.S. to the Tennessee Valley and Gulf Coast in March. Nebraska precipitation ranked second wettest for the month. Below-average precipitation occurred across the Northwest, northern Plains, Northeast, as well as portions of the Southeast, Deep South and West. Montana and North Dakota ranked second driest on record for the month.
- Precipitation across Alaska during March was much above average across western and northwestern Alaska as well as south of the Brooks Range. Juneau reported its snowiest March since 2007.
- According to the March 30 U.S. Drought Monitor report, nearly 44 percent of the contiguous U.S. was in drought, down from 46.6 percent at the beginning of March. Drought conditions intensified and expanded across portions of the Northeast, Texas, northern Plains and California. Drought intensity and/or coverage lessened across parts of the central Rockies and central Plains as well as across Puerto Rico and was eliminated in Hawaii.

Year-to-date (January-March)
Temperature

- Above-average temperatures were present across the Northern Tier and Northeast as well as portions of the West and Southeast. Despite the broad extent of warmth seen during March across the Lower 48, temperatures over the first three months of the year were near average across a wide portion of the U.S. This was in large part due to the cold weather experienced during February. Below-average temperatures occurred across portions of the South.
- The Alaska January-March temperature was 6.3°F, 0.4°F above the long-term average, ranking in the middle third of the record for the state. Above-average temperatures occurred across Bristol Bay and the Aleutians during the first three months of 2021 with the remainder of the state experiencing near-average conditions.

Precipitation

Above-average precipitation stretched from the central Plains to the East Coast during January-March. Nebraska ranked second wettest on record. Dry conditions were present across much of the West, northern Plains, Great Lakes, Northeast and parts of the South and Southeast. North Dakota ranked driest on record for this three-month period.

For more detailed climate information, check out our comprehensive March 2021 U.S. Climate report scheduled for release on April 13, 2021.
Here is sine more March 2021 climatology:
Here is one major “ET” reported from Thursday:
Here is more climate and weather news from Thursday:
(As usual, this will be a fluid post in which more information gets added during the day as it crosses my radar, crediting all who have put it on-line. Items will be archived on this site for posterity. In most instances click on the pictures of each tweet to see each article. The most noteworthy items will be listed first.)
Now here are some of today’s articles and notes on the horrid COVID-19 pandemic:
(If you like these posts and my work please contribute via the PayPal widget, which has recently been added to this site. Thanks in advance for any support.)
Guy Walton “The Climate Guy”