Thursday July 16th… Dear Diary. The main purpose of this ongoing blog will be to track United States extreme or record temperatures related to climate change. Any reports I see of ETs will be listed below the main topic of the day. I’ll refer to extreme or record temperatures as ETs (not extraterrestrials).
Main Topic: Prolonged Historic U.S. Heat Wave…Update #12: Heat To Build In The Plains And Move Into The Midwest And Northeast This Weekend
Dear Diary. Our heat wave, after diminishing some on Wednesday, will be intensifying and expanding northward the next four days. This heat wave in the United States will be historic because of its duration but not so much because of its intensity, or at least so far this summer season. Folks in Washington D.C. can attest to that where a streak of 90°F days record could be tied today without breaking many daily records:
The forecast for D.C. today is only 88°F so that streak of 90°F days may not be broken, however it will be getting much hotter in that city with temperatures getting to about 100°F next week.
As usual to start this blog let’s access U.S. heat levels for the next two days. Our low level CAT 1 heat wave from yesterday will be about the same today. Heat advisories remain across the south-central states:

On Friday heat will be building in the western Plains and intensifying across the South:
A few records may fall from Oklahoma southward into Texas at minor stations with relatively short times of recording surface observations.
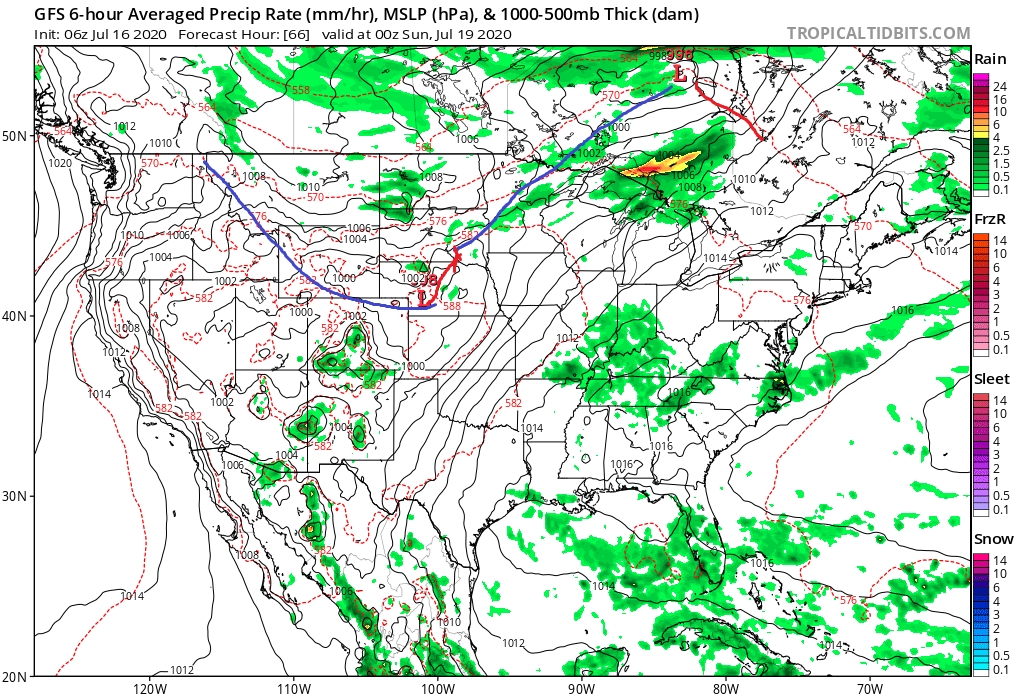
A front developing in the northern Plains will advect hot air into the Upper Midwest and Northeast on Saturday and Sunday on westerly and southwesterly winds (I crudely drew this front on the following chart without any frontal pips.):
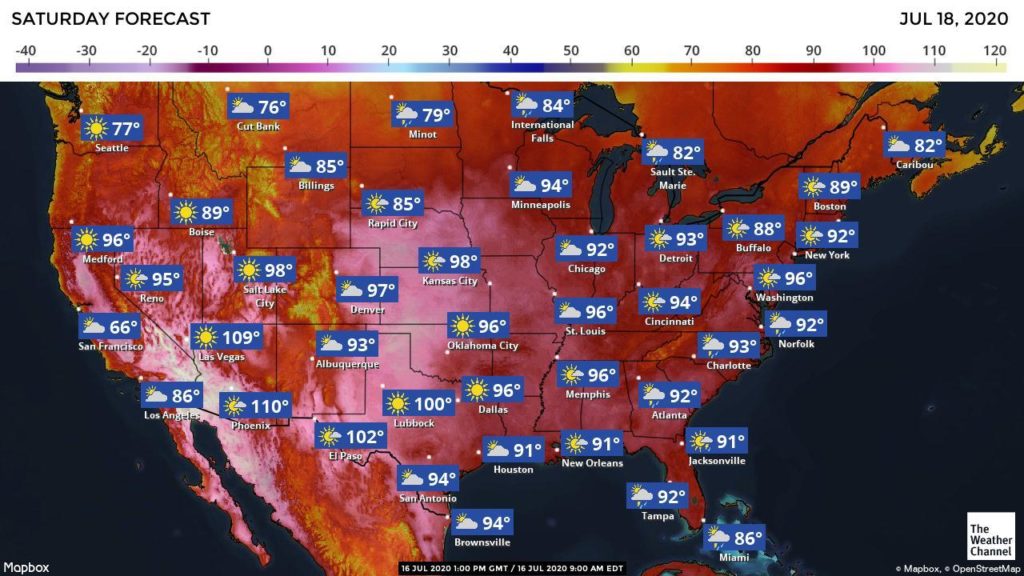
Here are some weekend forecasts:
Mid 90s will be felt as far north as Minneapolis on Saturday:
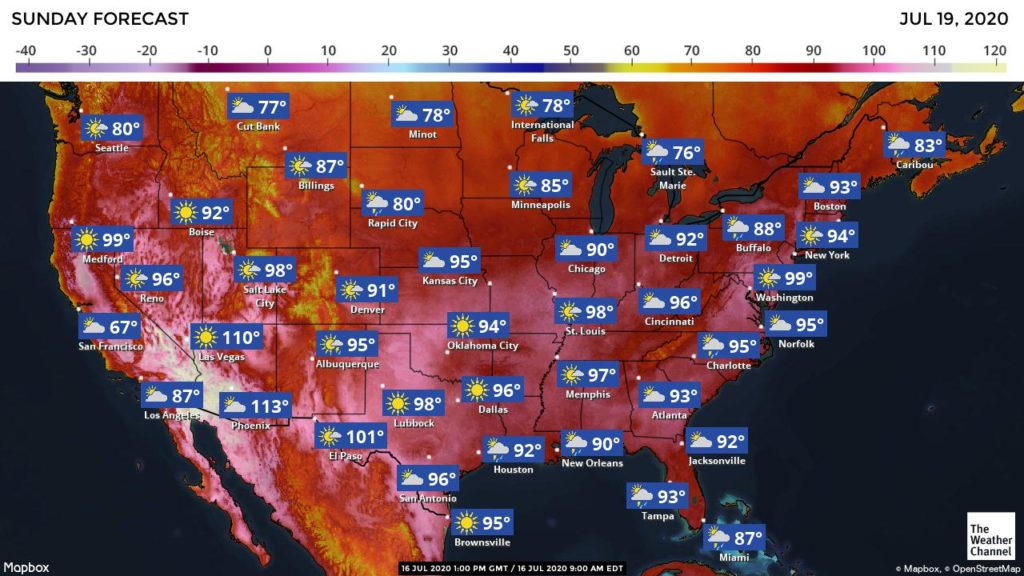
By Sunday maxes in the mid-upper 90s are forecast from St. Louis to Cincinnati to Washington D.C.
By the weekend our CAT 1 heatwave should be ramping up to a CAT 2 status. For my rough subjective definitions of CAT 1-5 read this:
I do expect that this heat wave will diminish again next week with our heat dome shrinking some, getting well below 594 decameters:
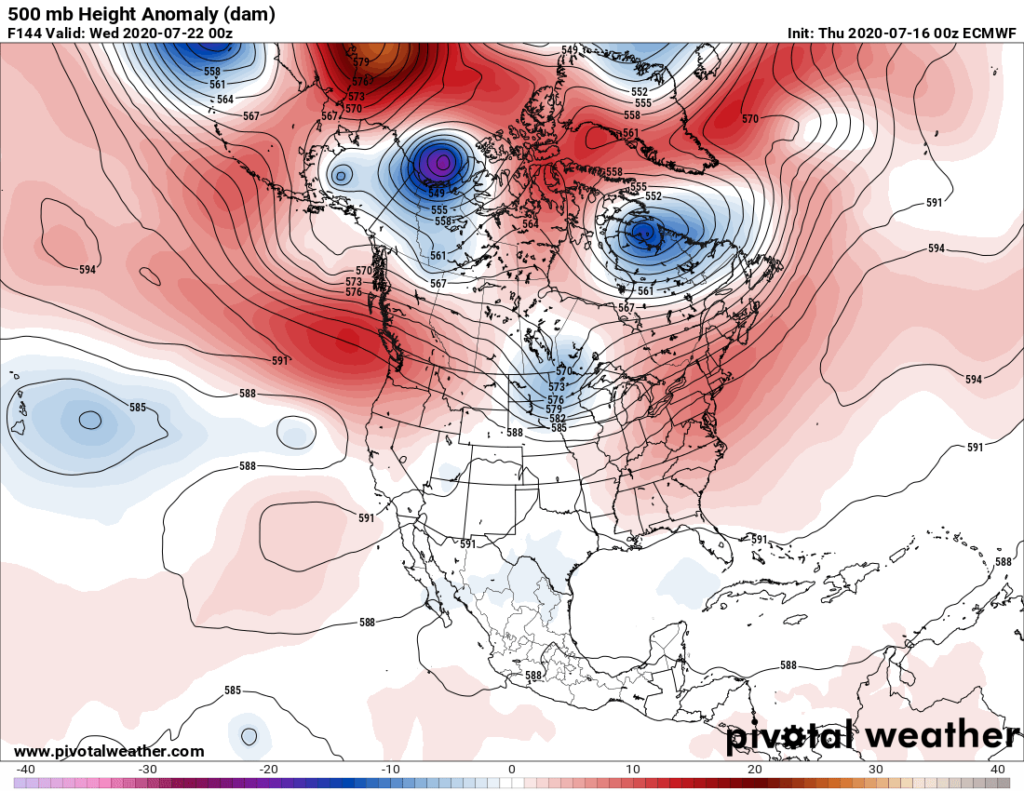
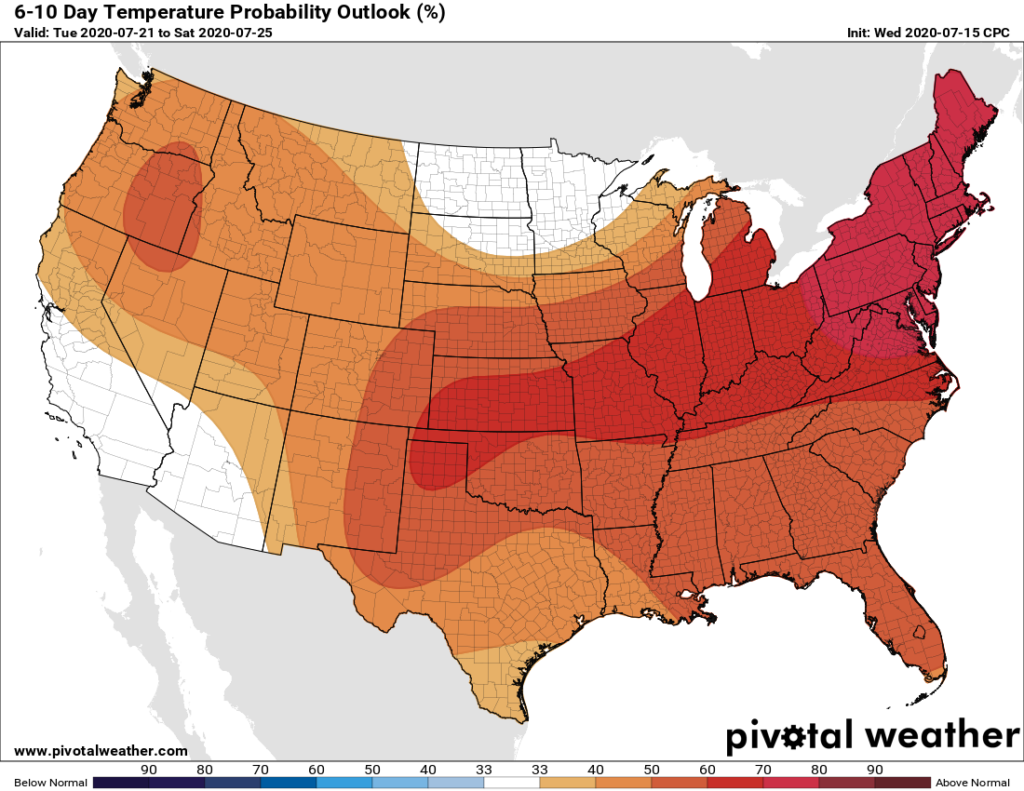
Usually a cold pocket/short wave of the intensity forecast to move into the Great Lakes, as noted by the above chart, will put an end to any heat wave in the East but not so during this torrid July. The ridge should rebuild in the East by the following weekend; thus, we have this outlook:
Let’s pray that we don’t see the ridge rebuild to this extent:
As usual, I’ll be posting more updates on this dangerous heat wave as the day progresses.
Here is a hot “ET” from overseas:
Here is more climate and weather news from Thursday:
(As usual, this will be a fluid post in which more information gets added during the day as it crosses my radar, crediting all who have put it on-line. Items will be archived on this site for posterity. In most instances click on the pictures of each tweet to see each article. The most noteworthy items will be listed first.)
Here are some special Climate Central stats on 2020’s global heat:
https://medialibrary.climatecentral.org/resources/global-temperatures-near-hottest-on-record
Global Temperatures Near Hottest on Record
JUL 13, 2020
The numbers are in for the first half of 2020’s global temperatures—and they are nearly the hottest on record once again.
See full multimedia package here >>KEY CONCEPTS | EXPERTS TO INTERVIEW | METHODOLOGY
KEY CONCEPTS
- Using combined NOAA and NASA data, we find that 2020 has been the planet’s 2nd-hottest year on record through June.
- Year-to-date temperatures are 1.36℃ (2.45℉) above a 1881-1910 baseline—approaching levels from the record-setting year of 2016. This year is 90% likely to finish among the top three.
- Warming will continue as long as we emit greenhouse gases. While emissions temporarily declined this spring during global shutdowns, they are quickly rising back to normal in much of the world.

Global Temperatures Near Hottest on Record
Find All Image Types Here (JPG & PNG)

Global Temperature Anomalies in 2020 So Far
Find All Image Types Here (JPG & PNG)
With the release of June global temperatures from NOAA and NASA, the results are in for the first half of 2020. Even in this tumultuous time, the Earth is still warming—as continued greenhouse gas emissions lead to near-record temperatures once again. Using combined NOAA and NASA data, we find that 2020 has been the planet’s 2nd-hottest year on record so far.
The statistics are striking:
- This year is ‘virtually certain’ to finish among the top five, which would make the seven latest years the seven hottest in 140 years of records.
- 2020 also has a 36% chance to eclipse 2016 as the hottest on record, even without an El Niño—the pattern that propelled 2016 to its record heat.
- Year-to-date temperatures are 1.36℃ (2.45℉) above a rebaseline from 1881-1910, which indicates warming since the early industrial era.
- According to the World Meteorological Organization, the next five years may stay at least 1℃ above pre-industrial levels, and even approach the Paris Agreement’s aspiration of a 1.5℃ limit.
- June was the 426th consecutive month with temperatures above the 20th century average.
These numbers are even more extreme near the poles. On June 20, the Siberian town of Verkhoyansk reached 100.4℉—an earth-shattering Arctic record that was later confirmed by Russia’s meteorological service. Parts of Siberia were up to 18℉ hotter than normal in June, leading to a record wildfire season with the highest estimated CO2 emissions in 18 years of monitoring.
What happens in the Arctic doesn’t stay in the Arctic. When these wildfires burn and polar permafrost thaws, even more greenhouse gases are released to heat our planet. A similar vicious cycle occurs with melting sea ice, which is near a record-low as well. The Arctic is warming more than twice as fast as the rest of the world.
Other regions have felt the heat too. Antarctica broke temperature records in February, and sustained heat this year has covered the globe from Northern Europe to South America. In the U.S., South Florida has observed 134 record highs (and counting) this year, and only one record low—a stunning reminder of this imbalance in most areas. Through June, the U.S. has had its 8th hottest year out of 126 on record.
Warming will continue as long as we emit greenhouse gases. While emissions declined this spring during global shutdowns, they are quickly returning to normal in much of the world. From renewable energy to smarter agriculture to education, it will take major changes to bend the rising curves of CO2 and global temperatures.
NATIONAL EXPERTS
Ahira Sánchez-Lugo — Physical Scientist, NOAA National Centers for Environmental Information (NCEI), Center for Weather and Climate (CWC), Ahira.Sanchez-Lugo@noaa.gov
*Available for interviews in Spanish and English
Jennifer Brady — Senior Data Analyst, Climate Central, jbrady@climatecentral.org
METHODOLOGY
Monthly global temperature analyses are independently calculated by NASA and NOAA/NCEI. Climate Central combines the NOAA and NASA information to re-baseline global temperatures using an earlier pre-industrial baseline of 1881-1910 in response to the Paris Climate Change Agreement. NASA’s calculations are extended to account for temperature changes at the poles, where there are fewer stations. NOAA does not use any extrapolation to account for low station density at the poles.
Now here are some of today’s articles and notes on the horrid COVID-19 pandemic:
(If you like these posts and my work please contribute via the PayPal widget, which has recently been added to this site. Thanks in advance for any support.)
Guy Walton… “The Climate Guy”