The main purpose of this ongoing blog will be to track planetary extreme, or record temperatures related to climate change. Any reports I see of ETs will be listed below the main topic of the day. I’ll refer to extreme or record temperatures as ETs (not extraterrestrials).😜
Here is a new feature for this blog, which I will add daily. This is the latest inciteful Green News Report from my friends Desi Doyen and Brad Friedman at Progressive Voices. Hit ‘continue reading,’ listen, then hit return to see my daily topics:
Main Topic: U.S. April 2026 Record Scoreboard and Climatological Review
Dear Diary. It’s time for our monthly climatological review. Here on this site, we usually present monthly summaries near the 8th of each month, and each is available by clicking the link below:
https://guyonclimate.com/category/record-scoreboard-climatological-reviews
I’m repeating this mantra every month:
Special note on March 2026 (the most anomalously warm U.S. month in the history of record keeping):
The number of record DHMX for that month has now far exceeded the number of that from March 2012 (17,146 to 13,208), which had the highest total for any single month since January 1880. The individual monthly totals for MHMX (3850) and MHMN (1703) records were also higher than any other totals for those datasets since January 1880.
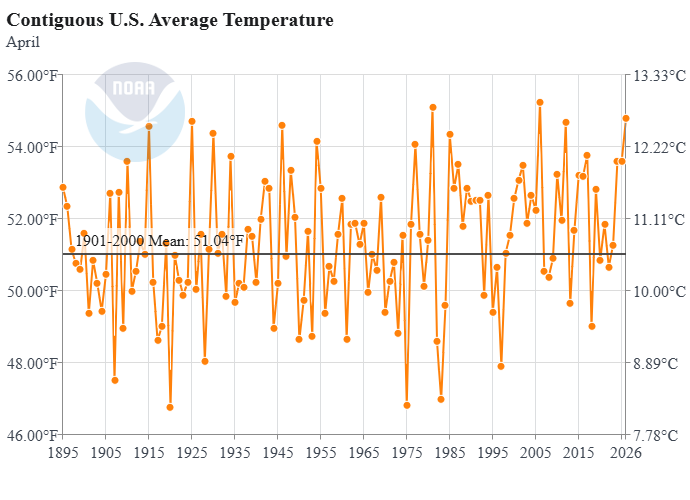
April 2026 was also a whopper of a warm anomalous month due to climate change across the United States but not as anomalously warm as March 2026.
April 2026 got ranked by the National Center for Environmental Information for the lower 48 states as 3rd warmest or 130th coolest since records began being kept in 1895 at +3.75°F above the 1901-2000 average.
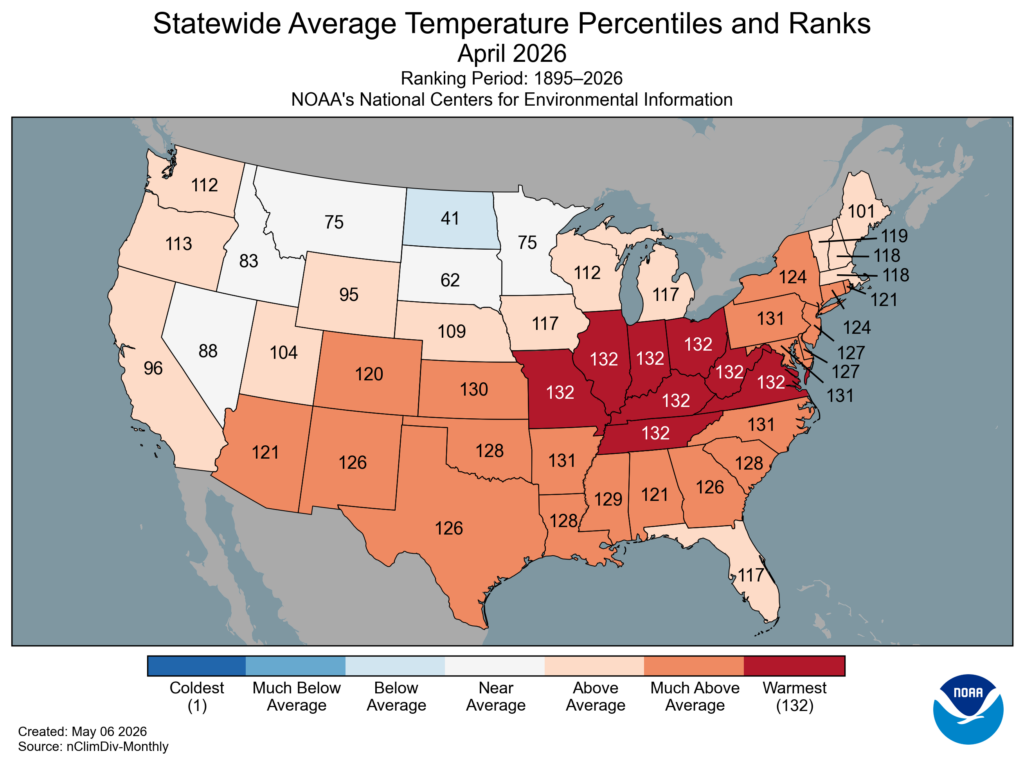
During April the warmest conditions were in the southern Midwest and Mid Atlantic area. The coolest weather occurred across the northern Plains. During March most reports of record warmth came from the South. Most reports of record chill came from the West and Northeast during the second half of the month.
You can check out record totals for yourself on my NCEI record archives:
NCEI Record Count Archive – Guy On Climate
Here are my two U.S. Daily Record Scoreboards updated through 5/08/2026 (data compiled from the following NCEI site):
https://www.ncdc.noaa.gov/cdo-web/datatools/records
I’m also keeping tabs on record report totals to verify a scientific study I helped to complete in the decade of the 2000s. We’ll eventually see how skewed ratios of record warm to cold reports get by the year 2100, which the study mentions as 50-1 for DHMX vs. DLMN:
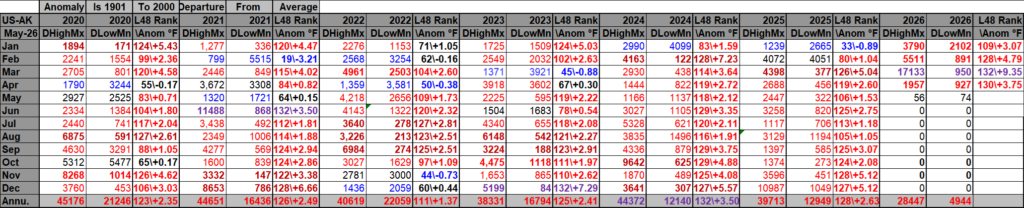
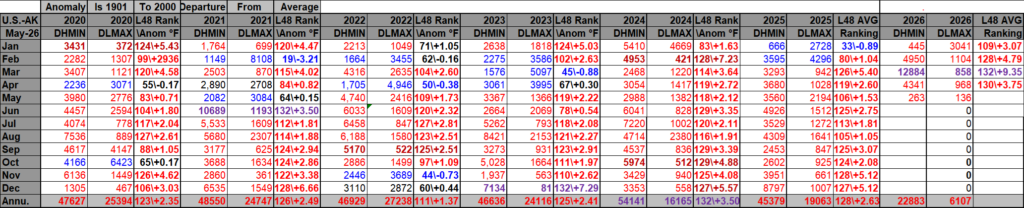
DHMX= Daily High Max Reports. DLMN= Daily Low Min Reports. DHMN= Daily High Min Reports. DLMX=Daily Low Max Reports.
Boldly highlighted red, blue, or purple colored months, such as December 2023 and June 2021, that have ratios of >10 to 1 daily or <1 to 10 of daily warm to low records are either historically hot or cold, most of which have made news. NCEI rankings are for the lower 48 states with the warmest ranking since 1895 of average temperatures being 132 and 1 being the coldest as of 2026. Blue colors represent cold months and red warm. Those months and years with counts close to a 1 to 1 ratio of highs to lows are colored black. All-time record hottest or coldest months and years are boldly colored in purple. The last month prior to March 2026 that was colored purple was December 2023. NCDC rankings have been color coded black representing neutral months or years (+ or – 10 from the average ranking of 66).
Totals are record reports for the entire United States including all territories minus those from Alaska. I’ve subtracted those from Alaska to get a better representation of what has occurred across the lower 48 states in association with lower 48 state rankings.
April 2026 had approximately a 19 to 9 ratio of record DHMX to DLMN individual record counts and was record warmest, so the color I used for that month was purple on the top chart.
April 2026 had approximately a 43 to 10 ratio of record DHMN to DLMX individual record counts, so the color I used for that month was red on the bottom chart.
Due to climate change, we are seeing fewer blue colors on these Record Scoreboards with time.
The average temperature lower 48 state ranking for April 2026 was 130, which was colored red. We are seeing fewer blue colors on my charts, and April 2026 was yet another warm month.
I color rankings of +10 to -10 from the average ranking for the lower 48 states of 66 black, indicating that these are near average temperature wise. The top warmest ranking for 2026 would be 132 since rankings began in 1895.
May 2026 has gotten off to a cool start from the Rockies to the East Coast. Models indicate that conditions could be warming for the second half of the month, though. May should be warmer than average but probably will be the coolest of the spring months relative to average.
Interestingly, here is what we see as far as overall yearly ratios go for the 2020s so far. Warmth is key here:
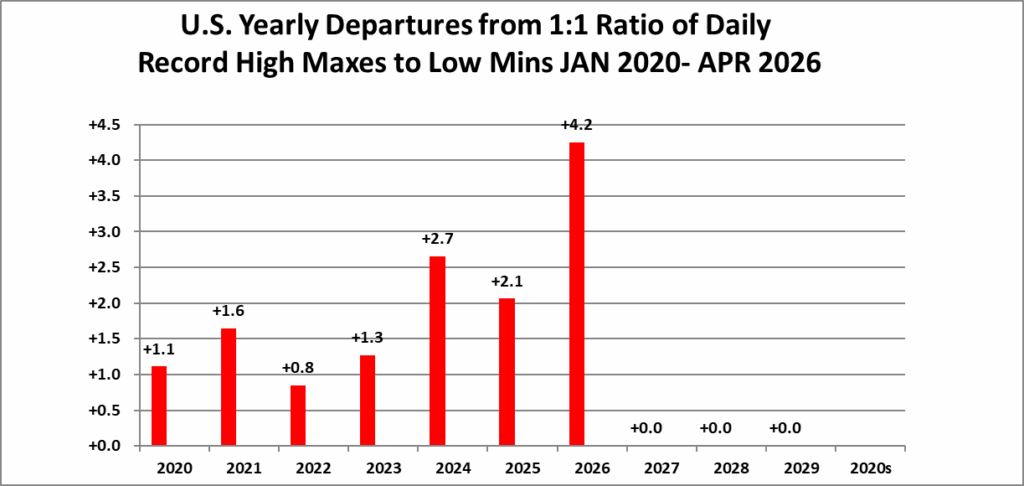
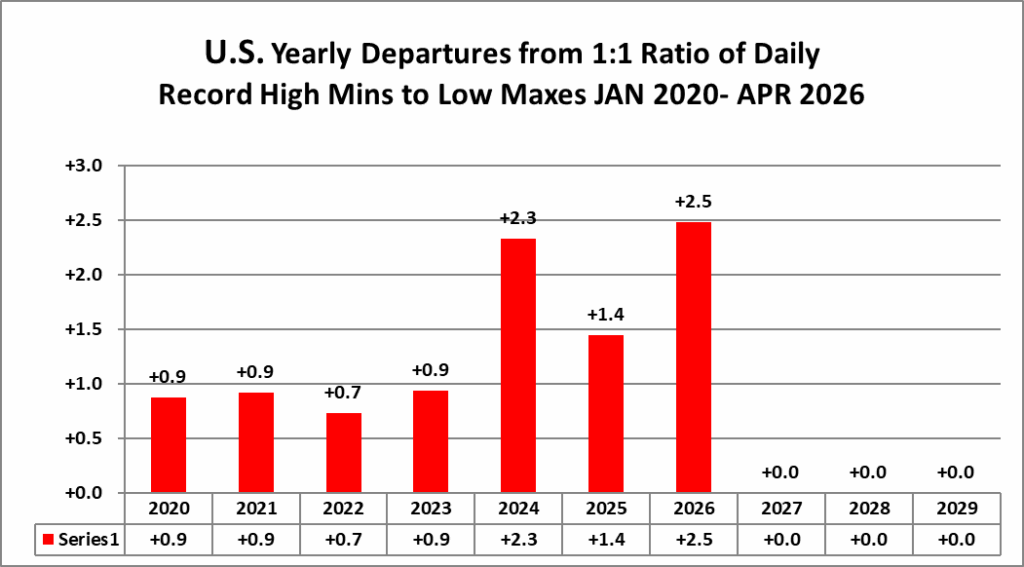
We now have 6 out of 10 full years’ worth of data for the 2020s. Interestingly, 2026 now stands out as the warmest year after March 2026 data got processed.
Here is much more detailed climatology for April 2026 as complied by NOAA:
Assessing the U.S. Temperature and Precipitation Analysis in April 2026
Warm April across the U.S. marked by wet conditions in the north and persistent drought in the southeast

Courtesy of Canva.com
May 8, 2026
Key Takeaways:
- Warm April across the contiguous U.S. (CONUS): The CONUS experienced its third-warmest April on record, with record-warm average temperatures observed across more than 700 counties and affecting more than 50 million people.
- Historic year-long warmth: The last 12 months (May 2025–April 2026) were warmer than any other 12-month period on record for the CONUS.
- Midwest precipitation record: The Upper Midwest climate region experienced its wettest April on record, receiving approximately twice its average precipitation.
- Widespread and intense drought: Severe to exceptional drought covered over 40% of the CONUS, with the Southeast experiencing its greatest extent on record.

Other Highlights:
Temperature
The average temperature over the CONUS in April was 54.79°F, 3.75°F above average, ranking as the third-warmest April in the 132-year record and the warmest since 2006. April marked the 15th consecutive month (February 2025–April 2026) with CONUS temperatures above the 20th-century average.

Above-average temperatures covered much of the CONUS in April, with below- to near-average conditions mostly confined to portions of the northern tier from the northern Rockies to the Minnesota Arrowhead. Widespread much-above-average to record-warm conditions spanned the central and eastern U.S., from the southern and central Plains through the Ohio Valley and Lower Great Lakes to the Mid-Atlantic and Carolinas.
Based on NOAA climate region averages, the Ohio Valley experienced its warmest April on record. Eight states set statewide April temperature records: Missouri, Illinois, Indiana, Tennessee, Kentucky, Ohio, West Virginia and Virginia. Notably, Indiana, Kentucky and West Virginia each broke long-standing April records set in 1896 by more than 1°F and exceeded their 20th-century April averages by more than 8°F. An additional 16 states ranked among their 10 warmest Aprils on record (24 states total). In contrast, North and South Dakota were the only states with April temperatures below the 20th-century average.
The average temperature for Alaska was 26.2°F, 2.9°F above the 1925–2000 average, ranking in the middle third of the 102-year record. In Hawai‘i, the average temperature was 66.1°F, 1.4°F above the 1991–2020 average, tied for the second-warmest April in the 36-year record.
For the year to date, the CONUS experienced an exceptionally warm start. January–April temperatures averaged 44.8°F, 5.7°F above average, the warmest such period in the 132-year record. Ten states matched or exceeded their previous January–April temperature records. In contrast, Alaska statewide average temperature was 2.3°F below average, ranking in the coolest third of the 102-year record.
Precipitation
Total precipitation averaged across the CONUS in April was 2.69 inches, 0.17 inch above the 20th-century average, ranking in the middle third of the 132-year record. Despite the near-average April total, the CONUS observed a notably dry start to the year; January–April precipitation totaled 7.49 inches—1.98 inches below average (79% of average)—ranking as the second-driest January–April on record.

During April, above-average precipitation fell across parts of the West and Northwest, as well as a broad corridor extending from southern Texas through the middle Mississippi Valley into the Upper Midwest and Great Lakes. Conversely, western portions of the Plains and much of the Southeast and Mid-Atlantic received below-average precipitation.
A sharp contrast in precipitation was evident across the U.S. Wisconsin and Michigan each recorded their wettest April on record, and the Upper Midwest climate region observed its wettest April, receiving approximately twice its average precipitation. The region also observed its second-highest January–April precipitation total on record.
In contrast, the Southeast climate region had its driest April in 40 years, receiving roughly half of its average precipitation. Six Atlantic coastal states—from Georgia to Delaware—ranked among their ten driest Aprils. The region also recorded its driest January–April on record, with precipitation below 60 percent of average, contributing to widespread drought conditions across the Southeast.
Precipitation was generally above average across much of Alaska, with below-average conditions mostly confined to parts of the Panhandle, while statewide totals ranked in the middle third of the record.
Hawai‘i recorded 6.06 inches of precipitation in April, 1.05 inches above the 1991–2020 average, ranking in the wettest third of the record, continuing a recent pattern of above-average precipitation. The island chain experienced its wettest start to the year in the 36-year record, with January–April precipitation totaling 41.50 inches—19.43 inches above average.
Drought
According to the April 28 U.S. Drought Monitor report, about 61.7% of the CONUS was in drought, an increase of about 1.8% from the end of March. Severe to exceptional drought (D2–D4) covered 43.8% of the CONUS, the largest extent since August 2012.
Drought conditions persisted, expanded or intensified during April across much of the interior West and western portions of the central and southern Plains, the Southeast and Mid-Atlantic. In contrast, drought contracted or decreased in intensity across eastern portions of the central and southern Plains, the middle Mississippi Valley, upper Midwest and the Great Lakes.
Notably, the Southeast experienced its most extensive drought on record in April, with 99.8% of the region in drought on the April 21 U.S. Drought Monitor map—the highest coverage in the record dating to 2000 and well above the previous maximum of 86.2% in August 2007. The Drought Severity and Coverage Index (DSCI) for the Southeast exceeded 350 for the first time on record, with nearly 60% of the region in extreme to exceptional drought (D3–D4).
Monthly Outlook
Above-average May temperatures are forecast across much of the western CONUS and parts of the Southeast, with the highest probabilities over the Northwest, while below-average temperatures are favored across the Great Lakes and Ohio Valley. Below-average precipitation is favored across much of the Northwest, northern Plains and Upper Midwest, with above-normal precipitation expected across parts of the Southwest, southern Plains and lower Mississippi Valley. Visit the Climate Prediction Center’s Official 30-Day Forecasts for more details.
Drought is expected to persist across much of the western CONUS in May, with further expansion likely in parts of the Northwest, northern Rockies and Plains. While much of the Southeast drought is expected to persist, improvement is likely across portions of the southern Plains and Deep South, as well as parts of the far Northeast. Visit the U.S. Monthly Drought Outlook website for more details.
Significant wildland fire potential for May is above normal across parts of the Southwest and northern Plains as well as the southeastern coastal region, from the central Gulf to Mid-Atlantic. For additional information on wildland fire potential, visit the National Interagency Fire Center’s One-Month Wildland Fire Outlook.
For more detailed climate information, check out our comprehensive April 2026 U.S. Climate Report scheduled for release on May 13, 2026. For additional information on the statistics provided here, visit the Climate at a Glance and National Maps webpages.
Published
May 8, 2026
Here are some “ETs” recorded from around the U.S. the last couple of days, their consequences, and some extreme temperature outlooks, as well as any extreme precipitation reports:
Here is More Climate News from Friday:
(As usual, this will be a fluid post in which more information gets added during the day as it crosses my radar, crediting all who have put it on-line. Items will be archived on this site for posterity. In most instances click on the pictures of each tweet to see each article. The most noteworthy items will be listed first.)