Saturday October 13th… Dear Diary. The main purpose of this ongoing post will be to track United States extreme or record temperatures related to climate change. Any reports I see of ETs will be listed below the main topic of the day. I’ll refer to extreme or record temperatures as ETs (not extraterrestrials)😊. Here is today’s main climate change related topic:
Early October U.S. Record Count Trends
Now that most dire weather has calmed down across the CONUS due to Michael’s exit off the East Coast it’s time to take stake of daily record trends for the current month, October, and to point out why doing so can give us clues regarding warning signs for the future.
I typically post record count updates around the 10th of each month for all to peruse. Each month I have started the habit of presenting my “NCEI record count scoreboard” and temperature trends for the rest of the month, which I will show on this post for October 2018. I’m like a laundry machine on wash, rinse, repeat mode.😉
First, let’s look at that scoreboard of counts of National Center for Environmental Information daily high maximum and low minimum records (updated through 10/11/2018 https://www.ncdc.noaa.gov/cdo-web/datatools/records):
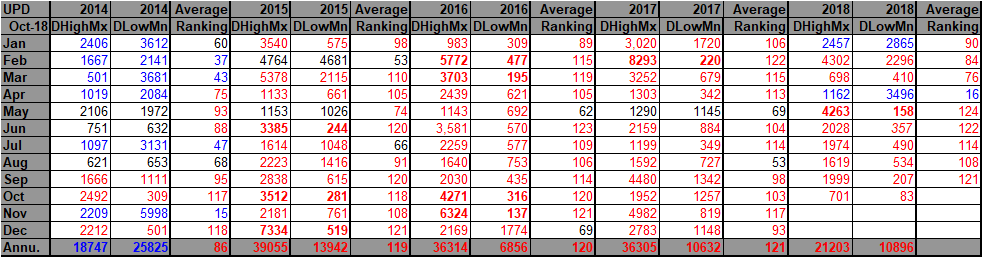
For this data set all monthly ratios of > 10 to 1 DHMX to DLMN or > 10 to 1 DLMN to DHMX are in bold type. The rankings are for the lower 48 states with the warmest ranking since 1895 of average temperatures being 124 and 1 being the coldest as of 2018. Blue colors represent cold months and red warm. Those months with counts close to a 1 to 1 ratio of highs to lows are colored black. Boldly colored months, such as May 2018, have ratios of more than 10 to 1 daily record highs to lows or lows to highs, and are either historically hot or cold. Notice that since the start of 2014 there have been 9 bold red months and 0 bold blue months as far as recent history goes. September 2018 got close to that bold red threshold coming in with just under a 10 to 1 ratio of record DHMX to DLMN individual counts.
Since presenting this chart last time I’ve added the ranking of 121 for September 2018, meaning that September 2018 was 4th warmest on record since records began in 1895. Notice that so far we have many more daily high maxes recorded for October than daily low minimums for the country (701 to 83).
We see another big clue for climate change attribution for Michael in the eastern U.S. from September into early October 2018 on the Record Scoreboard…the heat. All of these fall “red” months on the Record Scoreboard are not a good sign for the U.S. that wants to stay clear of hurricanes. The more moisture and heat remaining over the U.S. during the fall the more likely deadly hurricanes will make landfall. As one can see there was plenty of heat for Florence and then Michael to interact with and strengthen in the East where most of September’s record high tallies on the Record Scoreboard came from.:
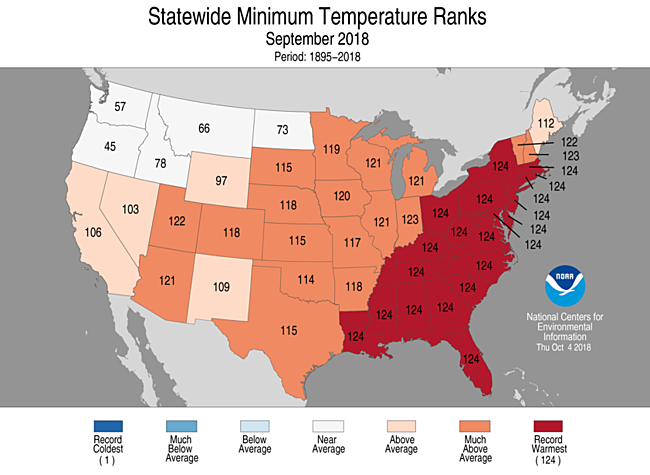
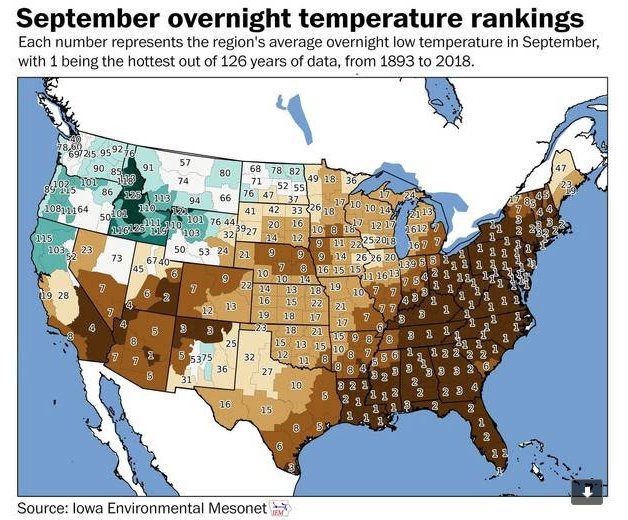
Also, high moisture content came unto play here leading to 4,156 record high minimums mostly set or tied in the East during the month of September. So far during October 2,478 DHMN have either been et or tied mostly in the East ahead of Michael’s landfall. What we saw in September persisted into October in the East. A warm and moist envelope of air surrounded both Florence and Michael aiding development. I didn’t notice any dry slots of air hindering Michael’s strengthening process coming southward from the U.S. towards the Gulf of Mexico.
We are in danger of seeing historic heat leading to deadly flooding storms and hurricanes now more than ever because of carbon pollution, which will come into play I’m sure again during summer and fall 2019. There are no guarantees, though, that somewhere along the line a relatively small cold wave anywhere in the U.S. may prevent October 2018 or any subsequent month from having more record highs than lows. Still, this warming trend on the Record Scoreboard is more than just a little bit unsettling.
…………………………………………………………………………………………………
Here is some more of today’s weather and climate news:
(As usual, this will be a fluid post in which more information gets added during the day as it crosses my radar, crediting all who have put it on-line. Items will be archived on this site for posterity.)
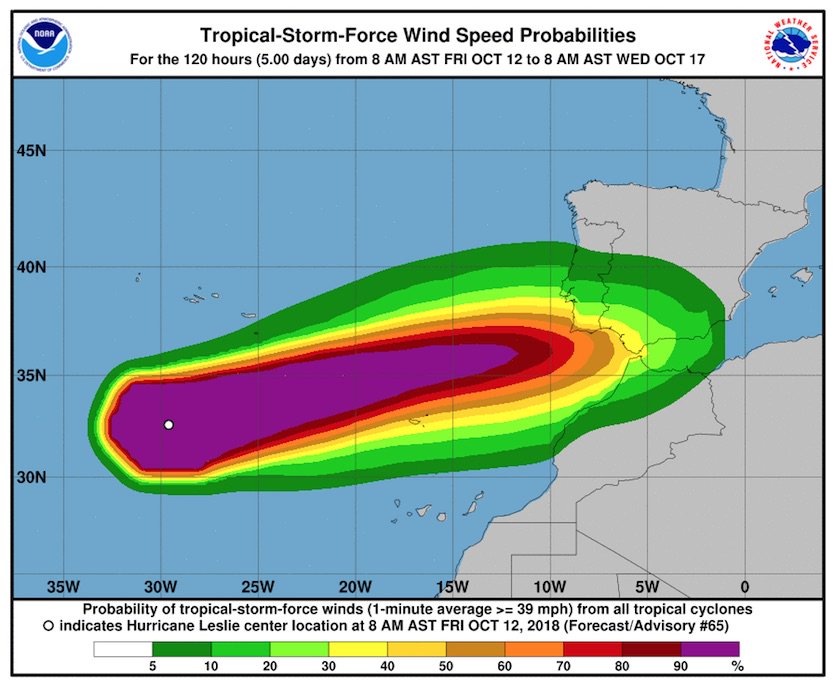
Le centre de #Leslie (oeil visible sur animation radar via @pppapin) a touché terre peu après 21UTC entre Aveiro et Figueira da Foz, environ 200 km au nord de Lisbonne. #Portugal
Une rafale de 122 km/h a été mesurée à Coimbra, dans l'intérieur proche !pic.twitter.com/cP3taUg0a9— Etienne Kapikian (@EKMeteo) October 14, 2018

Tonight, the rain in Spain falls mainly from..an ex-hurricane (#Leslie). The post-tropical system crashed ashore in Portugal with very strong winds https://bit.ly/2OWzR6K
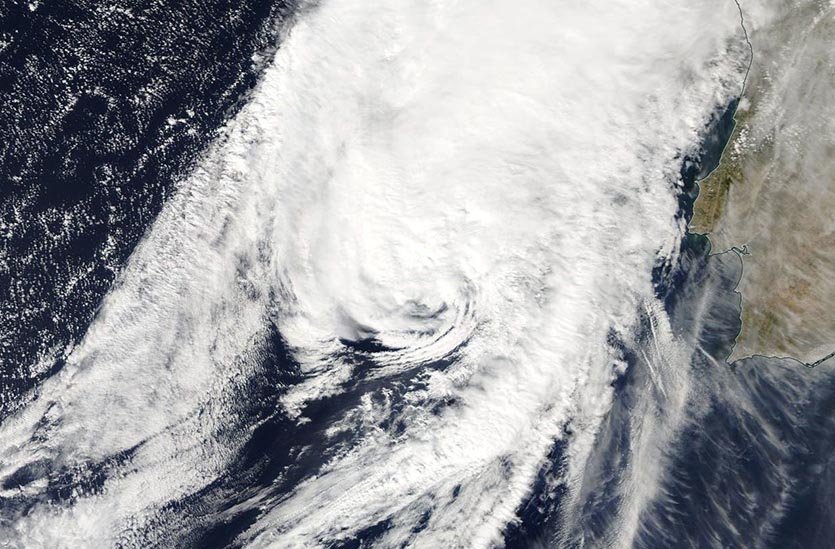

#Leslie like #Michael is moving into an area afected by a lot of record heat. @MichaelEMann @bhensonweather @scook2214 @DrShepherd2013 @BernadetteWoods @EKMeteo

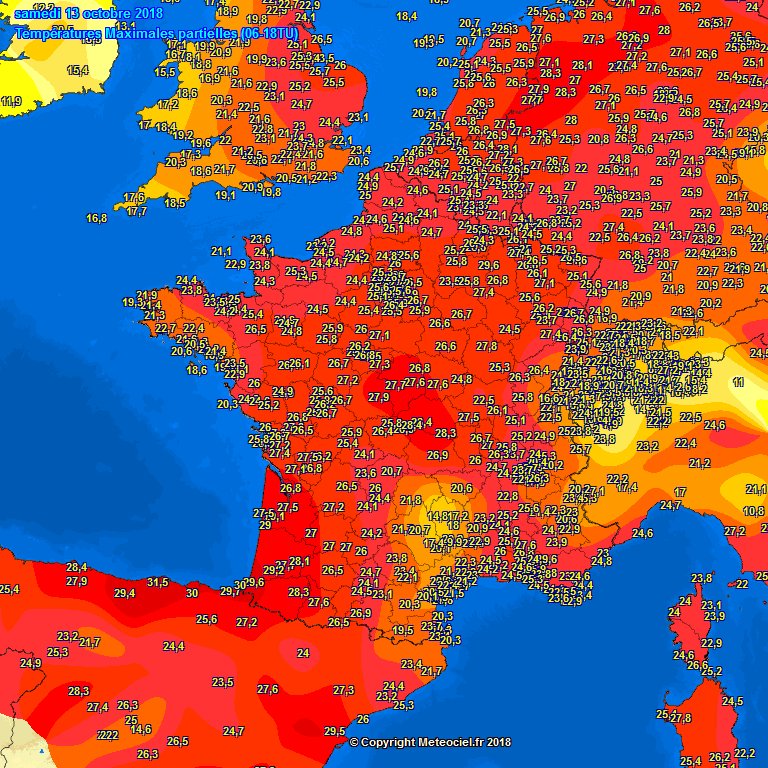
 Records décadaires de chaleur en France, 13/10/2018
27.4°C Luxeuil
27.2 Paris (26.4 11/10/1921)
27.1 Nancy
27.1 Orléans
26.7 Le Bourget
26.7 Melun
26.5 Metz
26.1 Bar-le-Duc/Erneville
25.5 Charleville-Mézières
24.7 St-Quentin (=15/10/1990)
max sur le pays : 30°C St-Jean-de-Luz
🌡️ Records décadaires Heat in France, 13/10/2018 27.4 °c Luxeuil 27.2 Paris (26.4 11/10/1921) 27.1 Nancy 27.1 Orléans 26.7 le Bourget 26.7 Melun 26.5 Metz 26.1 Bar-Le-DUC/D’erneville 25.5 Charleville-Mézières 24.7 St-Quentin (= 15/10/1990) Max on the Country: 30 °c St-Jean-de-Luz

The Hidden Tragedy Of Hurricane Michael And Georgia Agriculture – How It Affects You via @forbes
1:06 PM – 13 Oct 2018
Hurricane #Leslie is now just hours from landfall on the Iberian coast as it transitions into a post-tropical cyclone. If it maintains itself long enough, it would be the strongest storm to make landfall in this region. Regardless, dangerous flooding, wind, and surf are expected. pic.twitter.com/6xbvbXrRI1
— Tyler Stanfield (@TylerJStanfield) October 13, 2018
A strong tropical storm in Portugal? It might happen this weekend. #leslie https://bit.ly/2ND1IEs

Climate change is scary. Climate scientist look in the face every day. Here’s how we feel, and what keeps us going. Thanks @afreedma for asking! Read more: https://www.axios.com/newsletters/axios-science-9186b352-2f19-4229-acc9-e229e6a8204a.html …

(If you like these posts and my work please contribute via the PayPal widget, which has recently been added to this site. Thanks in advance for any support.)
The Climate Guy