Made March 2018/Updated AUG 2023/NOV 2024/FEB 2026/OCT 2026
The purpose of this post is to catalogue counts of all-time records (record high maximums\record high minimums\record low minimums\record low maximums) coming into the National Centers for Environmental Information’s site and all related charts and graphs produced in my Excel files for those data sets from Germany. All-time records are the highest or lowest temperatures recorded over the entire time a station has been recording data. For example, the all-time record high max for Atlanta Hartsville-Jackson Airport was 106°F set on 6/30/2012. I am in the process of constantly updating this data verifying the 2009 Meehl Et al. Surface Records Study published in Geophysical Research Letters that I initiated from 2000. Each individual count could be a tied surface record or one broken by several degrees Fahrenheit.
Here is the link to the NCEI site: https://www.ncdc.noaa.gov/cdo-web/datatools/records
More from NCEI:
The daily records summarized here are compiled from a subset of stations in the Global Historical Climatological Network. A station is defined as the complete daily weather records at a particular https://guyonclimate.com/2021/08/17/ncei-german-monthly-record-count-archive/, having a unique identifier in the GHCN-Daily dataset.
For a station to be considered for any parameter, it must have a minimum of 30 years of data with more than 182 days complete each year. This is effectively a “30-year record of service” requirement, but allows for inclusion of some stations which routinely shut down during certain seasons. Small station moves, such as a move from one property to an adjacent property, may occur within a station history. However, larger moves, such as a station moving from downtown to the city airport, generally result in the commissioning of a new station identifier. This tool treats each of these histories as a different station. In this way, it does not “thread” the separate histories into one record for a city.
This tool provides simplistic counts of records to provide insight into recent climate behavior, but is not a definitive way to identify trends in the number of records set over time. This is particularly true outside the United States, where the number of records may be strongly influenced by station density from country to country and from year to year. These data are raw and have not been assessed for the effects of changing station instrumentation and time of observation.
An updated 2015 study from Dr. Gerald Meehl indicates that the ratio of daily records from year to year will average around 15 to 1 by 2100:
Per one of the authors of both the 2009 and 2015 studies, Claudia Tebaldi said “This climate is on a trajectory that goes somewhere we’ve never been. And records are a very easy measure of that.”
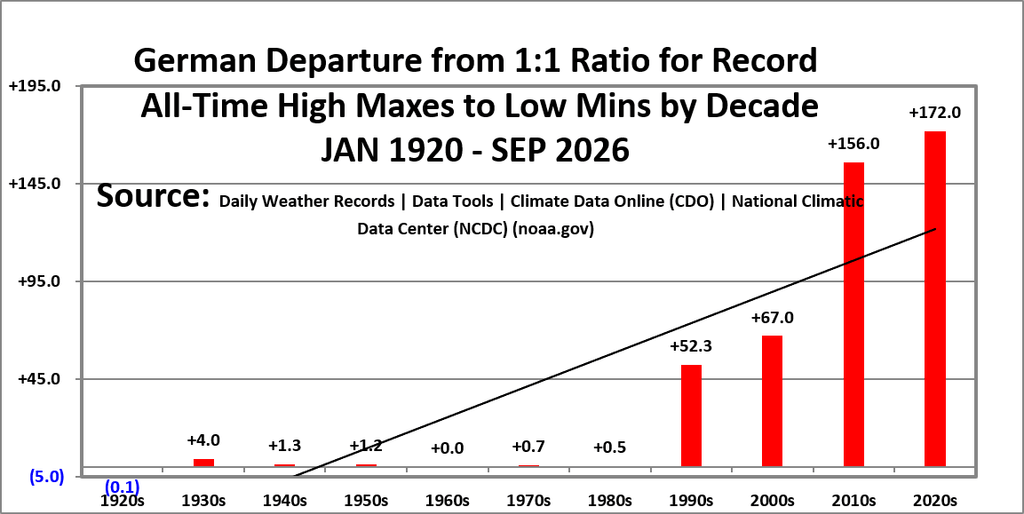
All of the data listed below is part of this one chart. The ratio of all-time record high maxes to low minimums is higher for the 2020s so far is higher than any other decade since the 1920s:
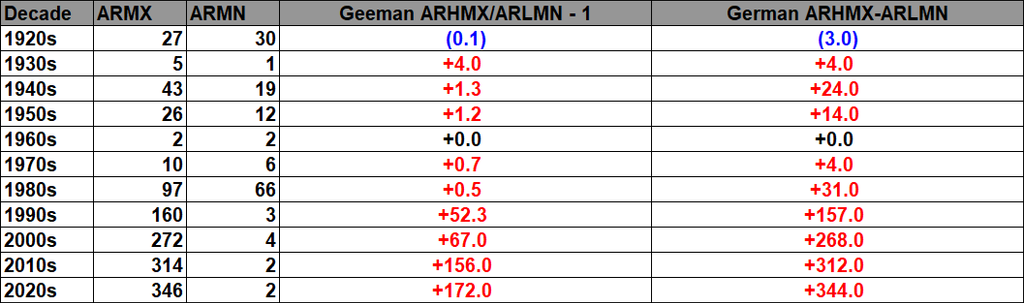
Here are the current all-time record counts of high maximums and low minimums per decade:
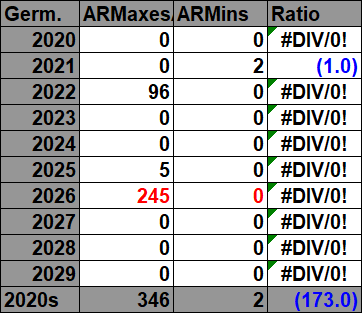
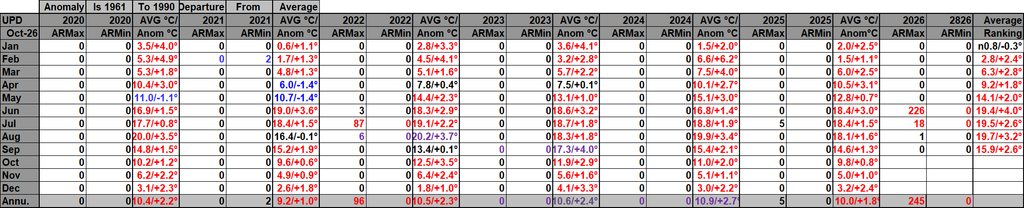
For the following data sets of record of monthly high minimums and low maximums I have opted not to boldly highlight ratios greater than 10 to 1. Blue colors represent cold months and red warm. Months and years that are all-time record cold or hot are colored purple. Temperature anomalies greater than +0.5°C are shown in red, while anomalies below −0.5°C are shown in blue. Values within ±0.5°C are shown in black. All-time warmest and coldest months and years are highlighted in purple. Record-count ratios are displayed separately using the established warm-versus-cold comparison. I have opted not to catalogue data prior to 1920 since all-time record counts decrease substantially prior to the decade of the 1920s. Time stamps for when I last updated counts are located in the upper left-hand corner of each chart. Drop me a note if you see an error or if you have suggestions for improvements.
The 2010s:


The 2000s:


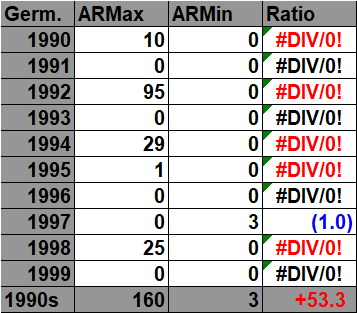
The 1990s:

The 1980s:


The 1970s:


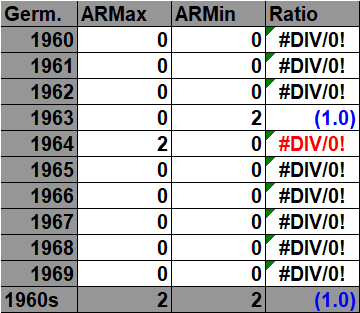
The 1960s:

The 1950s:


The 1940s:


The 1930s:


The 1920s:
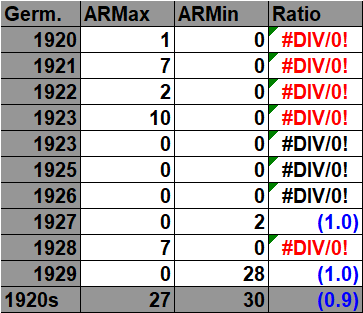

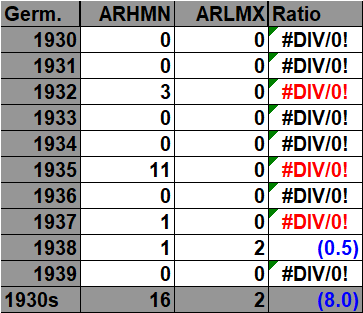
For the following data sets of German all-time record high minimums and low maximums blue colors represent cold months and red warm. Those months with counts close to a 1 to 1 ratio of highs to lows are colored black. I have opted not to catalogue data prior to 1920 since record counts decrease substantially prior to 1930. Time stamps for when I last updated counts are located in the upper left hand corner of each chart. Drop me a note if you see an error or if you have suggestions for improvements.
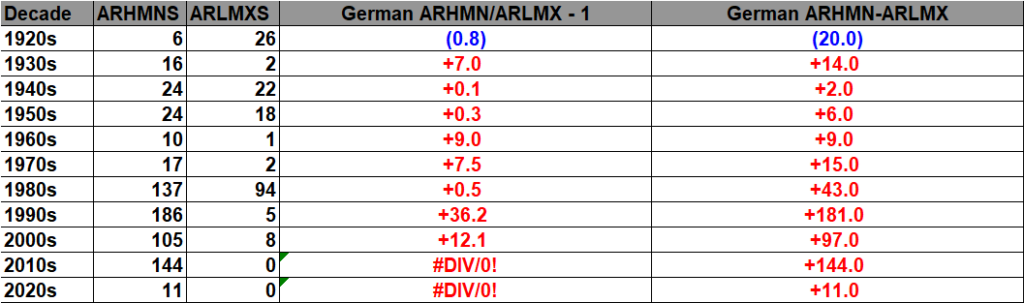
All of the data listed below is part of this one chart. The ratio of all-time record high minimums to low maximums for the 21st century is higher for the 2010s than any other decade since the 1920s:
*No all-time German low maxes have been reported since January 2006.*
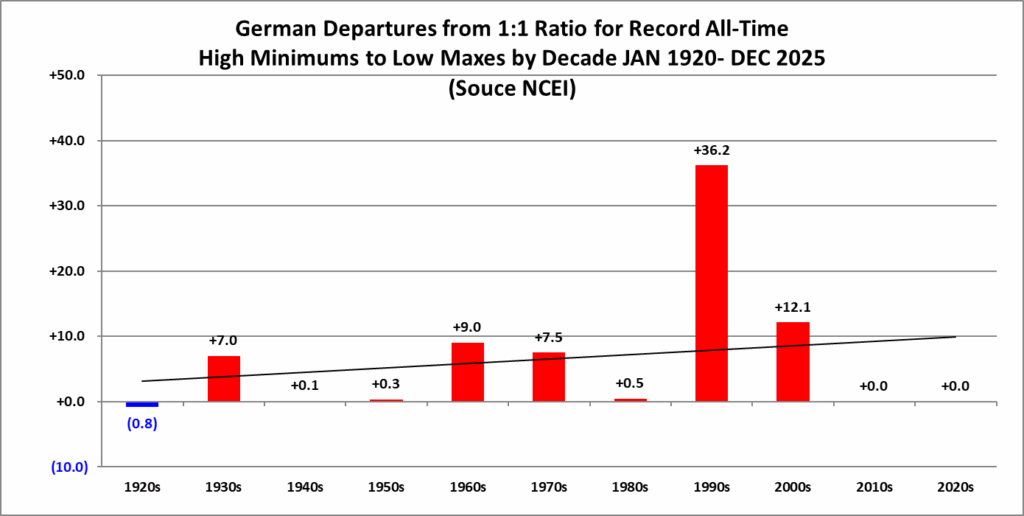
Here are the current all-time record counts per decade, which have gone into the prior chart:
The 2020s:
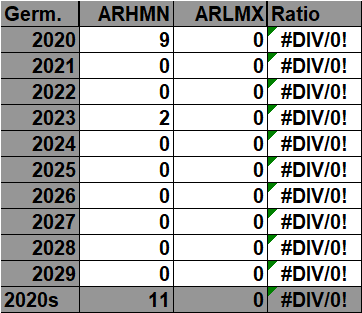
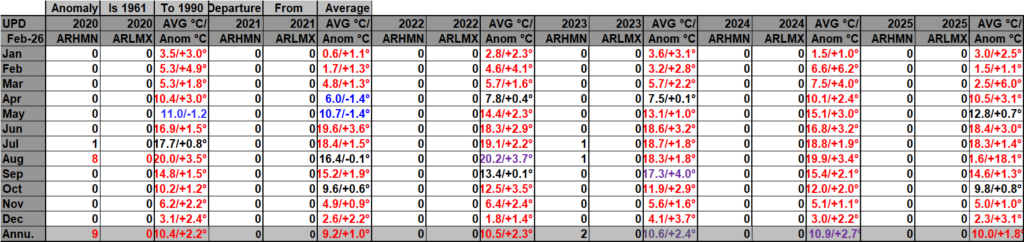
The 2010s:


The 2000s:


The 1990s:


The 1980s:


The 1970s:


The 1960s:


The 1950s:
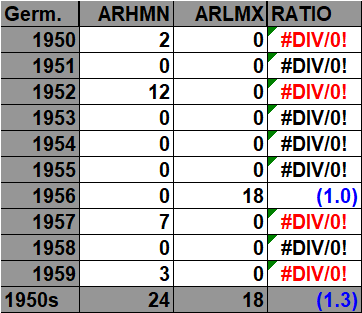

The 1940s:


The 1930s:

The 1920s:


These are all of the NCEI all-time German record counts back through 1920.
These are all of the counted reports of NCEI all-time German records back through 1920.
Guy Walton…”The Climate Guy”